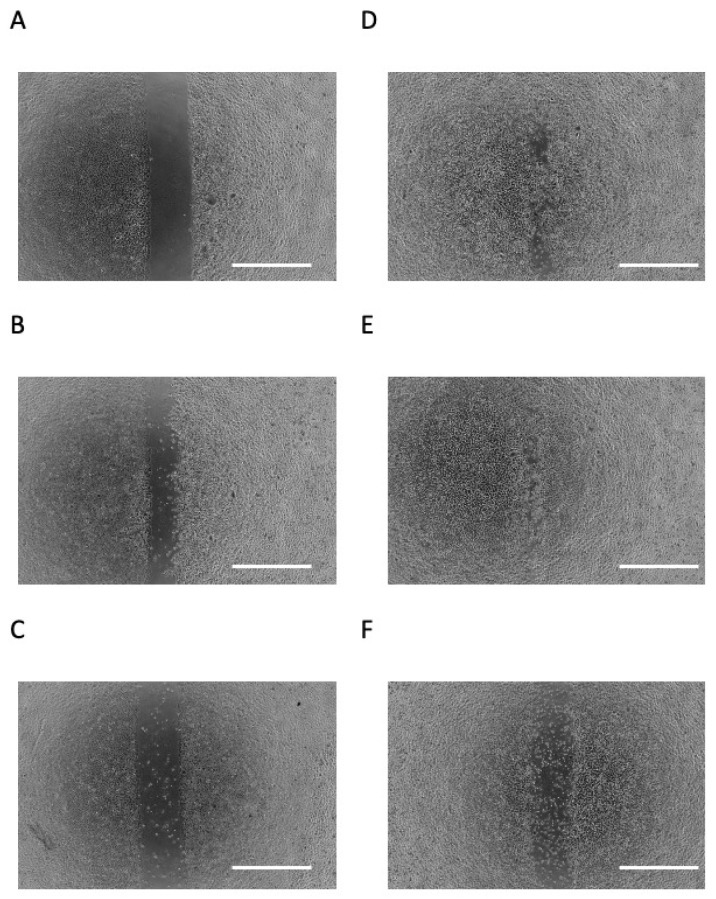
Figure 2.
Effects of butyric acid (BA) on cell migration. Photomicrographs of scratch assay at day 0 (A), incubated with several concentrations of sodium butyrate (NaB), 0 mM (B), 0.02 mM (C), 0.2 mM (D), 2 mM (E) and 20 mM (F), for 1 day. All photomicrographs showed typical example of six independent experiments. Scale bar = 1 mm.

