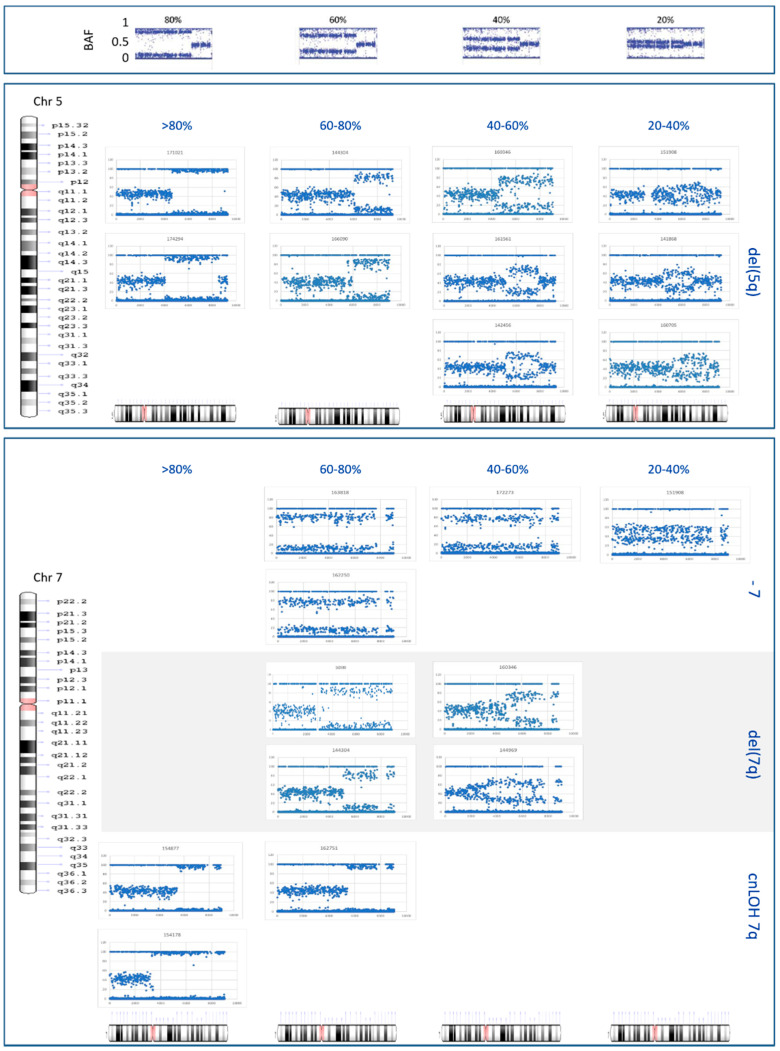
Figure 3.
B allele frequency (BAF) plots for regions of CNAs and cnLOH within chromosomes 5 and 7. The BAF plots reported by Song Sarah et al [34] as a result of a dilution series of tumor DNA in normal samples are shown at the top of this chart. These were used to establish the tumor burden of alterations found in our cohort. CNAs and cnLOH identified within chromosome 5 (i.e., del(5q); in the medium chart) and 7 (i.e., monosomy 7, del(7q), and cnLOH of 7q; in the bottom chart) were organized in four subgroups depending on the level of separation of the BAF. This diagram was also used to establish the breakpoints of alterations for each patient. Deletions smaller than 10 Mb (i.e., del(5q) in #144969 and del(7q) in #144206) are not shown.

