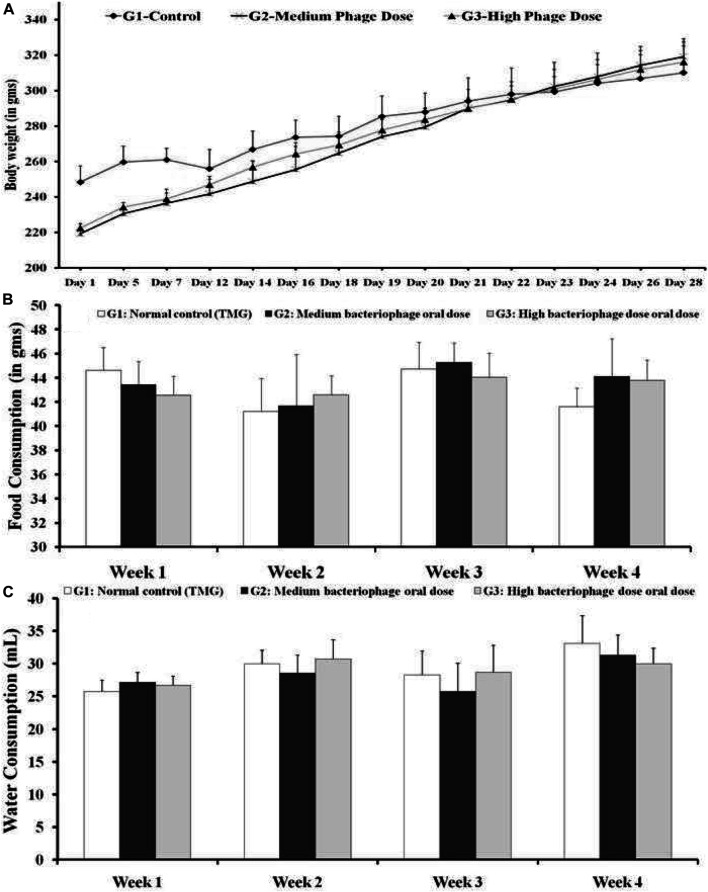
FIGURE 2.
(A) Body weights analysis (B) Average daily feed consumption and (C) Water consumption (in ml). G1: Control group animals received TMG (Tris-HCl, magnesium sulfate, gelatin pH 7.4) buffer; G2: Animals received oral administration of the medium dose of bacteriophages (1015 PFU/ml); and G3: High oral dose of bacteriophages (1020 PFU/ml). All the values are presented as mean ± SEM (n = 6). No significant difference could be found among the different groups (p > 0.05).

