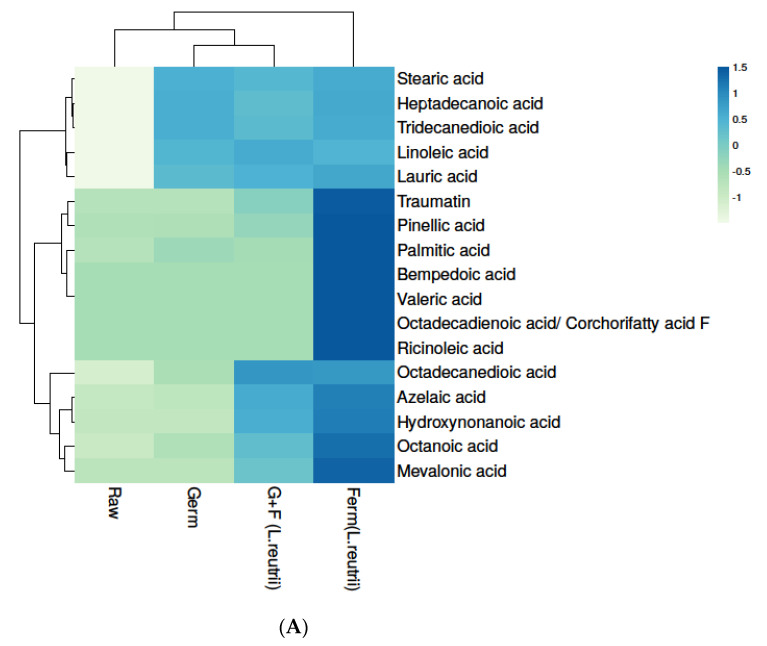
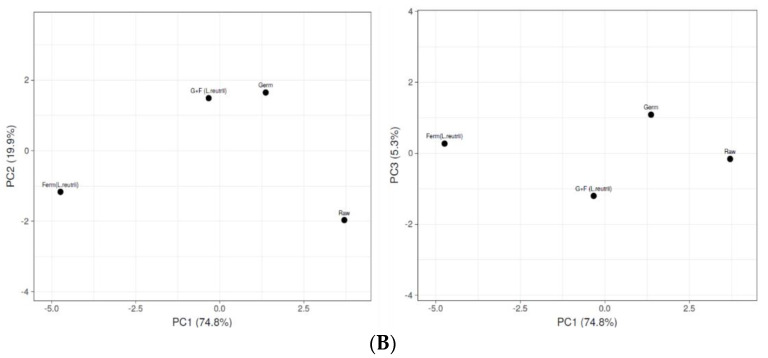
Figure 5.
Levels of fatty acid in raw, germinated, fermented (L. reuterii AKT1) and G+F (L. reuterii AKT1) samples. (A) The heat map shows different levels of fatty acid in samples based on colors, as blue to green represents the level of fatty acids in decreasing order. (B) Identification of principal component analysis (PCA) of Raw, Germ, Ferm (L. reuterii AKT1) and G+F was shown by comparing PC1 with PC2 as well as PC1 with PC3. Germ- germinated brown rice, Ferm- fermented brown rice, G+F- germinated + fermented brown rice.


