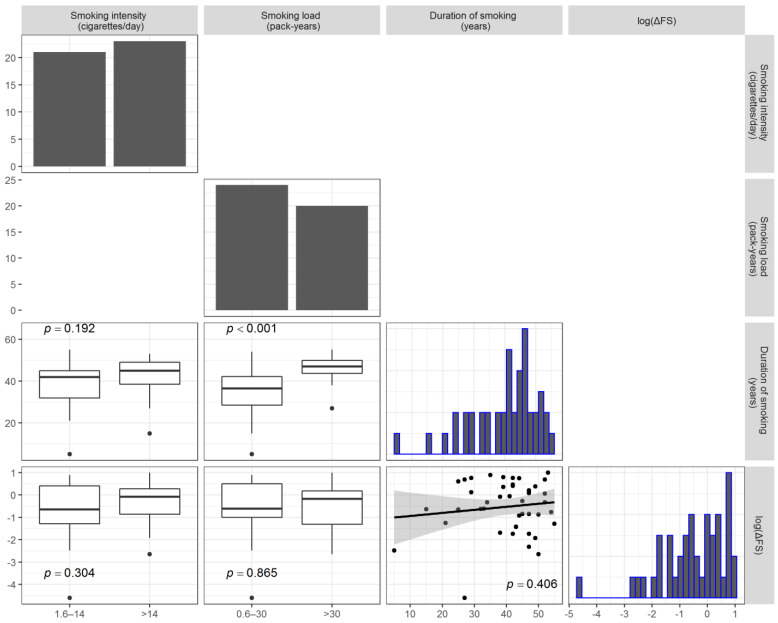
Figure 1.
Plot matrix depicting the pairwise associations between the smoking intensity (cigarettes/day), smoking load (pack-years), duration of smoking, and log-transformed ΔFS (lower diagonal elements). Comparisons with the smoking loads are reported as boxplots, whereas the correlation between the log-transformed ΔFS and duration of smoking is reported as a scatterplot with a fitted regression line. The distribution of each variable considered is reported as a bar chart or histogram along the diagonal. Only current smokers were considered to produce the analysis results presented here.

