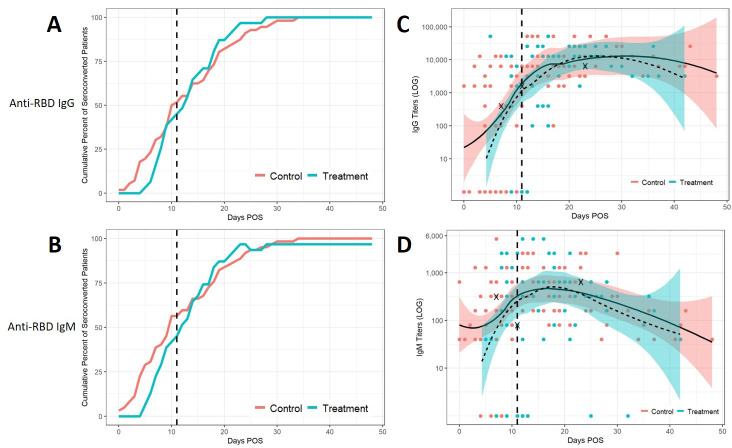
Figure 2.
Kinetics of anti-RBD IgG and IgM responses in CCP recipients and control patients. Cumulative frequency, as the per cent of seropositive CCP recipients (celeste blue line) and control patients (pink line), were plotted against the number of days postonset of symptoms (POS). Seropositive was defined as any titre measurement of IgG (A) or IgM (B) greater than 1:100 and 1:40, respectively. CCP recipients and controls were assumed to be seronegative prior to the first measurement (A, B). Scatter plots were used to display IgG (C) and IgM (D) responses as a function of days POS and a loess regression with a span of 0.75 was used to indicate overall trends. Shadings show the 95% CI for CCP recipients (dashed line, blue CI) and control patients (solid line, pink CI) (C, D). Bold X’s denote highest titres achieved by patients who were seronegative at the time of transfusion and did not survive (C, D). Vertical dashed line represents median days POS at which transfusion occurred (A–D). All titre levels were converted to a log 10 scale. Titers are shown on logarithmic (LOG) scale. CCP, convalescent plasma; RBD, receptor binding domain.

