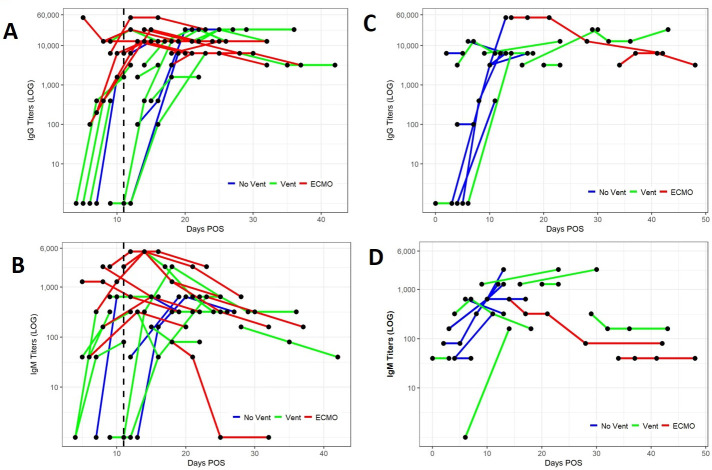
Figure 3.
Anti-RBD IgG and IgM longitudinal responses of individual CCP recipients and control patients. For CCP recipients, the first data point of each line represents patient IgG (A) and IgM (B) antibody titres immediately prior to CCP transfusion, and subsequent dots represent titres on post-transfusion days (3,7 and 14). The vertical dashed line represents median days postonset of symptoms (POS) at which transfusion occurred. For control patients, individual anti-RBD IgG (C) and IgM (D) titre longitudinal responses are shown on each line with each dot representing titres measured on sequential days POS. Only controls with sequential data points are shown (C, D). CCP and control patient samples are stratified based on the level of respiratory support needed; no ventilation (dark blue), ventilation only (green) or ECMO (red) (A–D). All titre levels were converted to a log 10 scale. Titers are shown on logarithmic (LOG) scale. CCP, convalescent plasma; ECMO, extracorporeal membrane oxygenation; RBD, receptor binding domain.

