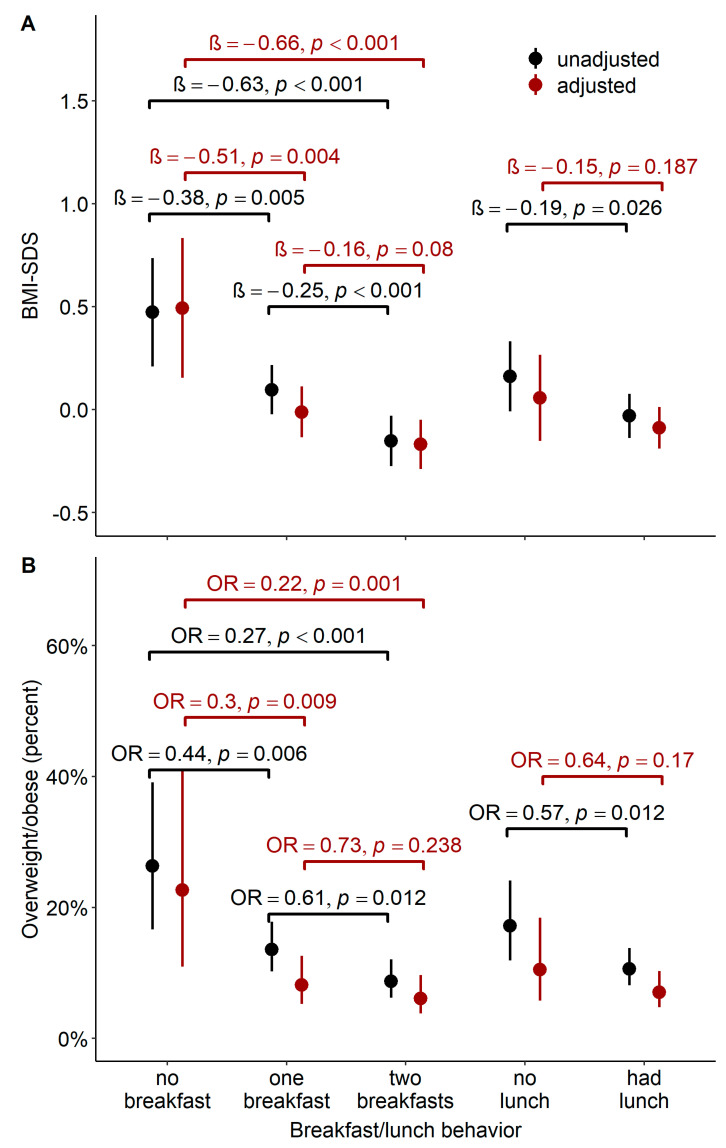
Figure 2.
Association of different eating habits with mean BMI-SDS/the likelihood of being overweight. (A). Mean BMI-SDS (incl. 95% CI) for children with different breakfast/lunch behavior: Based on the simple hierarchical regression analysis, children with different eating habits also differed in their mean BMI-SDS (black). Most of the associations persisted after adjustment (red). (B). The likelihood of being overweight (incl. 95% CI) for children with different breakfast/lunch behavior: based on the simple hierarchical logistic regression analysis, children with different eating habits also differed in their likelihood of being overweight (black). The difference in the likelihood between children having and not having breakfast remained statistically significant after adjustment (red).

