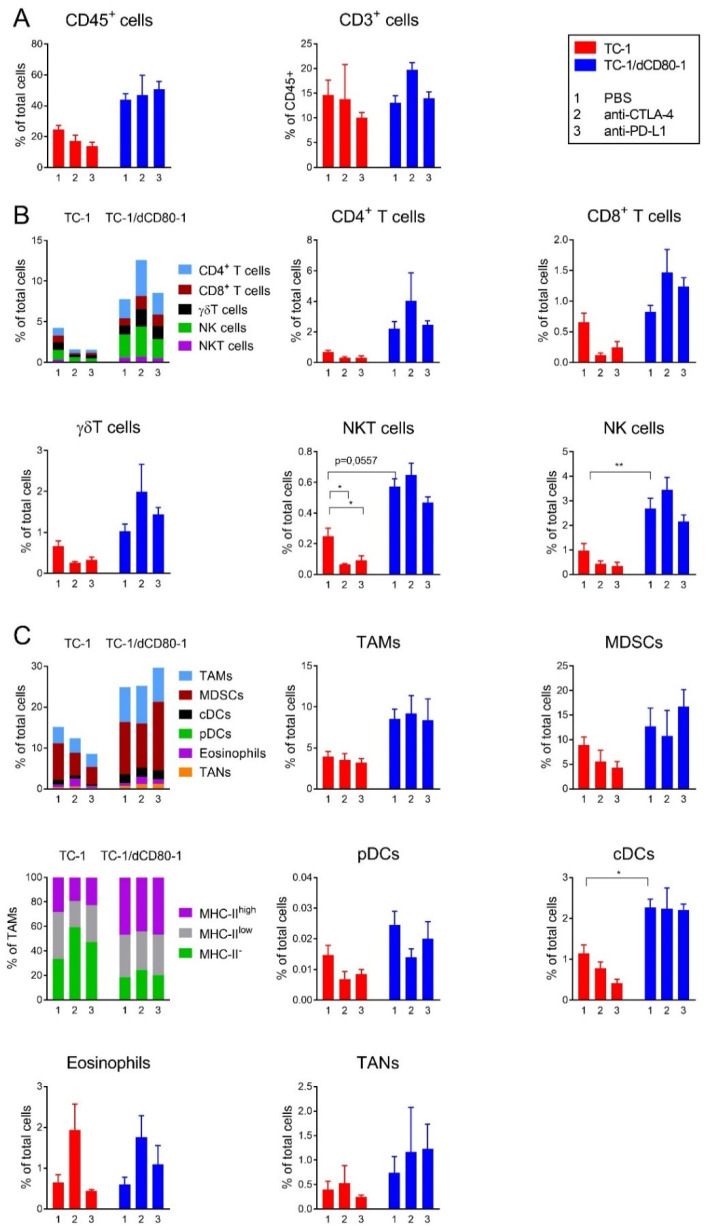
Figure 5.
Flow cytometry analysis of immune cells infiltrating TC-1- and TC-1/dCD80-1-induced tumors. Mice (n = 4) were treated with anti-CTLA-4 or anti-PD-L1 and PBS was used as the control. The total infiltration by immune cells and the proportion of lymphocytes were determined using CD45 and CD3 markers, respectively (A). Cell subpopulations were stained with panels of antibodies detecting either lymphoid (B) or myeloid cells (C). Bars indicate ±SEM; * p < 0.05, ** p < 0.01.

