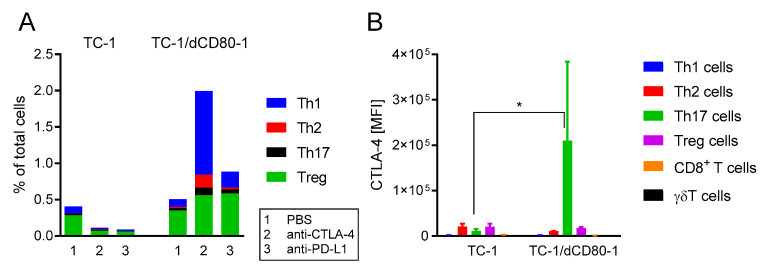
Figure 6.
Flow cytometry analysis of the CD4+ T cell subpopulations in TC-1- and TC-1/dCD80-1-induced tumors. Tumors (n = 4) were treated with the anti-CTLA-4 or anti-PD-L1 antibodies and PBS was used as the control. The frequency of CD4+ T cell subsets (A) and surface expression of CTLA-4 on T cells in tumors (B) was evaluated. Bars indicate ± SEM; MFI—median fluorescent intensity; * p < 0.05.

