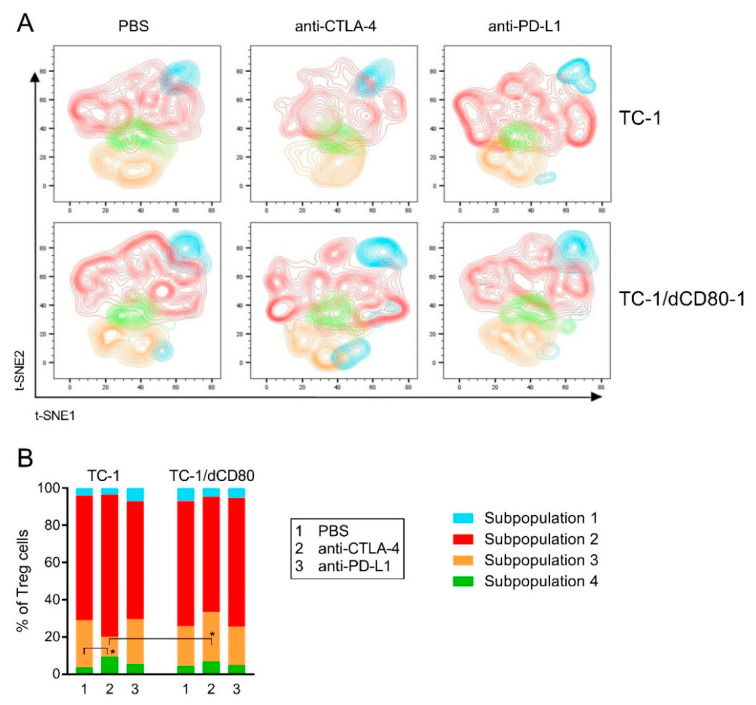
Figure 7.
Diversity of Treg cells. In cells isolated from tumors (n = 4) treated with PBS, anti-CTLA-4, or anti-PD-L1, distinct Treg subpopulations were identified by the FlowSOM algorithm in the concatenate of all groups of samples and projected into t-distributed stochastic neighbor embedding (t-SNE) plots (A). The frequency of Treg subpopulations was statistically evaluated (B). * p < 0.05.

