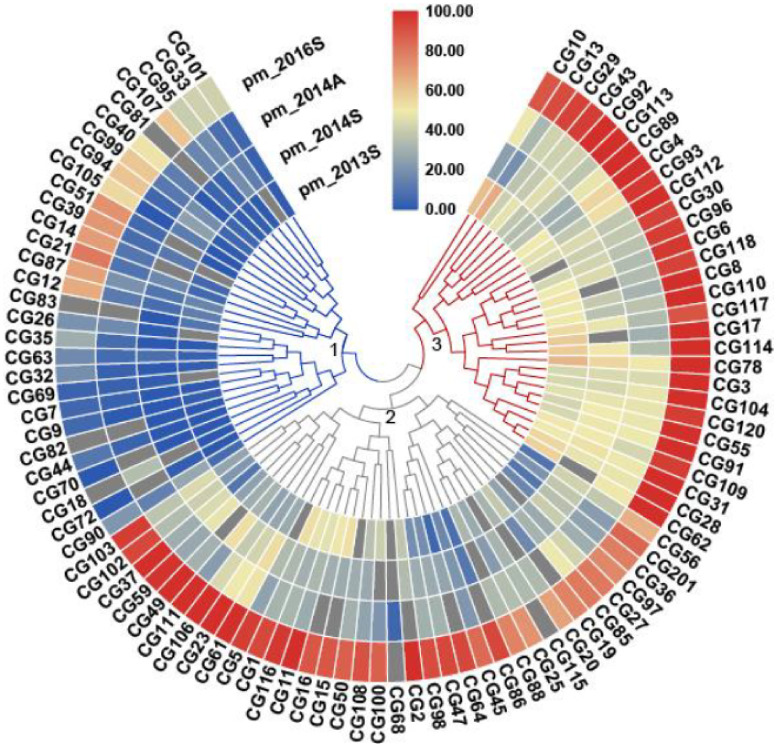
Figure 1.
Heatmap depicting the phenotypic distribution of disease index (DI) of powdery mildew (PM) resistance in four environments. The three clusters of the core germplasm (CG) lines are numbered with 1 to 3, and data of mean DI per CG line in the four experiments were used for this clustering analysis. The numbers next to the color key represent DI values. Blue means resistant and red susceptible. The intensity of the color indicates the level of resistance/susceptibility.

