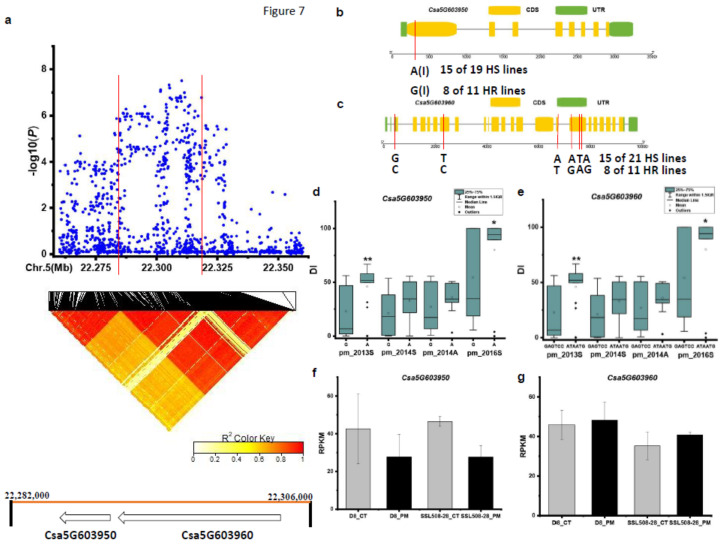
Figure 7.
Identification of the causal gene for the locus pmG5.3. (a) Local Manhattan plot [9] and LD heatmap (bottom) surrounding the peak of pmG5.3. (b,c) SNP variation of the candidate gene Csa5G603950 and Csa5G603960 between the highly susceptible (HS) and highly resistant (HR) lines (see Supplementary File S5). (d,e) Disease index (DI) comparison between haplotypes of the HS and HR lines of Csa5G603950 and Csa5G603960; (f,g) RPKM (reads per kilobase million) of candidate gene Csa5G603950 and Csa5G603960, respectively based on the transcriptome of PRJNA321023 (data obtained from http://cucurbitgenomics.org/rnaseq/home, accessed on 14 April 2021). (g) RPKM (reads per kilobase million) of candidate gene Csa5G603960 based on the transcriptome of PRJNA321023 (data obtained from http://cucurbitgenomics.org/rnaseq/home, accessed on 14 April 2021); * and ** indicate significance at p < 0.05 and p < 0.01, respectively.

