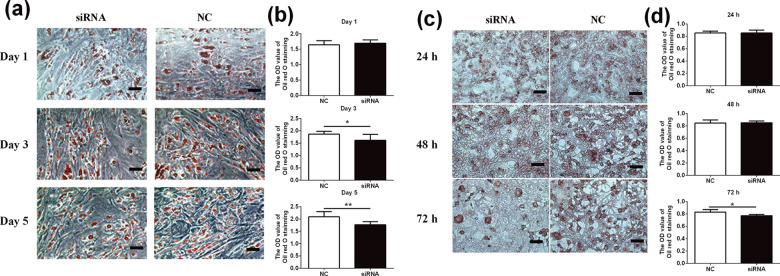
Figure 3.
The effects of AdPLA knockdown on the Oil red O staining intensity in HPA-s and 3T3-L1 cells. (a) Oil red O staining in HPA-s cell lines. (b) The average OD value of Oil red O staining in HPA-s cell lines. (c) Oil red O staining in 3T3-L1 cell lines at different time points. (d) The average OD value of Oil red O staining in 3T3-L1 cell lines at different time points. Data were presented as mean ± standard deviation; n = 6. *P < .05 (unpaired Student’s t-test).

