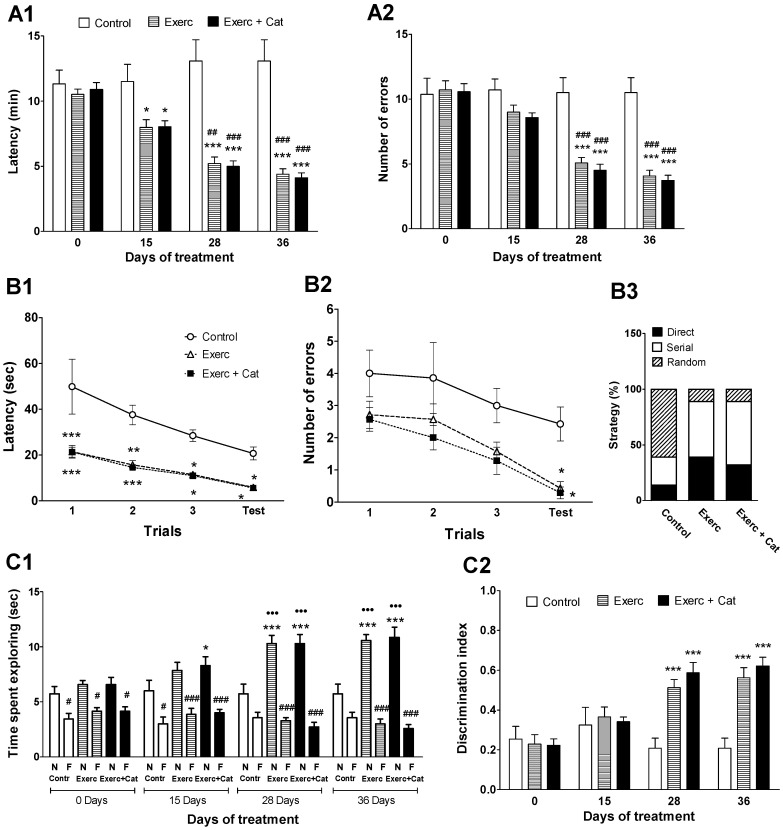
Figure 2.
Effects of exercise and the combined action of exercise and catechin on behavioral tests. (A) Effect on spatial working memory using the radial maze test in old rats. Bars represent the mean ± SEM of time taken to complete the test (A1) and errors made (A2) of animals subjected to exercise (Exerc, n = 7) and exercise together with catechin antioxidant treatment (Exerc + Cat, n = 7) versus the control group (n = 7). (A1) Two-way repeated measures ANOVA detected a significant effect of treatment (F(2,72) = 14.6, p = 0.0002), age (F(3,72) = 30.5, p < 0.0001), subjects (F(18,72) = 9.26, p < 0.0001) and the interaction (F(6,72) = 18.5, p < 0.0001). (A2) Two-way repeated measures ANOVA detected a significant effect of treatment (F(2,72) = 10.1, p = 0.0012), age (F(3,72) = 60.9, p < 0.0001), subjects (F(18,72) = 7.22, p < 0.0001) and the interaction (F(6,72) = 15.5, p < 0.0001). (B) Effect on visuospatial learning ability using the Barnes maze test in old rats. Dots represent the mean ± SEM of latency (B1) and errors made (B2) throughout the Barnes test of the same groups as A. The bars represent the average of the strategy followed in % with respect to the total sum of the 3 training and test stages (B3) of the animals. (B1) Two-way ANOVA repeated measures detected a significant effect of treatment (F(2,72) = 21.3, p < 0.0001), trial (F(3,72) = 17, p < 0.0001) and subjects (F(18,72) = 2.09, p = 0.0191), but not for the interaction (F(6,72) = 0.938, p = 0.4759). (B2) Two-way ANOVA repeated measures detected a significant effect of treatment (F(2,72) = 10.6, p = 0.0009) and trial F(3,72) = 10.1, p < 0.0001), but not for the subjects (F(6,72) = 1.38, p = 0.1820) or the interaction (F(6,72) = 0.161, p = 0.9859). ** p < 0.001 comparing with the control group; ## p < 0.01, ### p < 0.001 comparing the values obtained before and after performing the treatments in each group (two-way ANOVA, followed by Bonferroni test). (C) Effect on episodic memory using the novel object recognition test in old rats. Bars represent the mean ± SEM of the total time spent exploring for each object (N, novel object; F, familiar object) in the test phase (C1), as well as the discrimination index between the novel and familiar object in the test phase (C2) of same groups of animals. (C1) Three-way ANOVA detected a significant effect of treatment (F(2,144) = 17.179, p = 0.0327), age (F(3,144) = 2.999, p < 0.0001) and objects (F(1,144) = 296.749, p < 0.0001). (C2) Two-way ANOVA repeated measures detected a significant effect of treatment (F(2,72) = 8.77, p = 0.0022), age (F(3,72) = 16.8, p < 0.0001), subjects (F(18,72) = 2.68, p = 0.0027) and interaction (F(6,72) = 8.14, p < 0.0001). * p < 0.05, *** p < 0.001 when compared to the control group; # p < 0.05, ### p < 0.001 comparing the exploration time between the novel object and the familiar object; ●●● p < 0.001 when comparing the values obtained before and after performing the treatments in each group (C1: three-way ANOVA, followed by Fisher PLSD test; C2: two-way ANOVA, followed by Bonferroni test).

