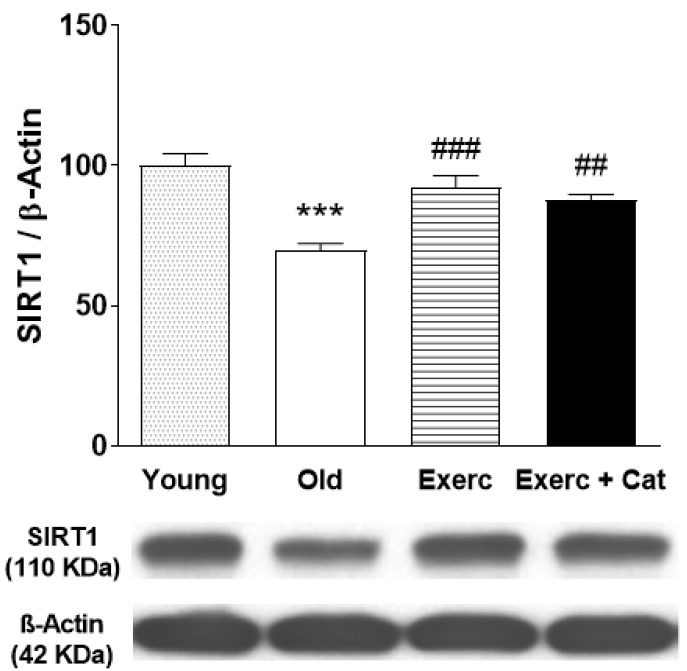
Figure 5.
Effect of exercise and the combined action of exercise and catechin treatment on SIRT1 (110 kDa) protein expression in the hippocampus of old rats and young control rats. Bars represent mean ± SEM of protein levels per group (animals subjected to exercise, Exerc, n = 7; exercise together with catechin, Exerc + Cat, n = 7; old control group, Old, n = 6) expressed as a percentage with respect to the young control group (n = 6). Protein level was normalized to β-actin content and each sample was analyzed in three different membranes. One-way ANOVA detected a significant effect (F(3,22) = 17.48, p < 0.0001). *** p < 0.001 when compared with young animals in the control group; ## p < 0.01, ### p < 0.001 when compared with old animals in the control group (one-way ANOVA, followed by Bonferroni test). A representative immunoblot of the changes obtained in SIRT1, with no changes in ß-actin (loading pattern), is shown below the graph.

