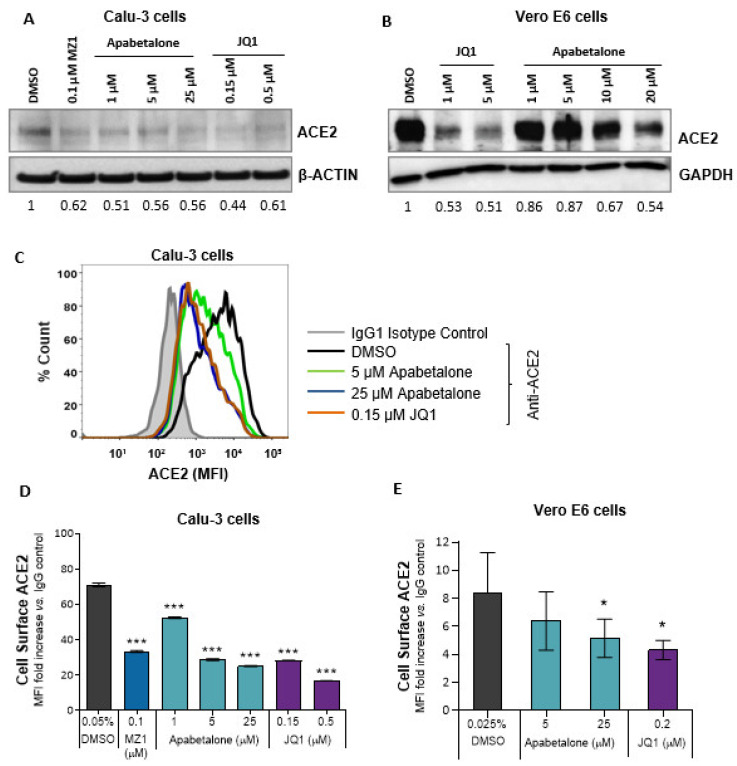
Figure 2.
BETi treatment reduced both surface and total ACE2 protein levels. (A) Immunoblot of total ACE2 protein in Calu-3 cells following BETi treatment for 48 h. Values below the blots indicate band quantification via densitometric analysis (ACE2/β-ACTIN) and are represented as fold change to vehicle-treated cells (0.05% v/v DMSO). (B) Immunoblot of total ACE2 protein in Vero E6 cells following BETi treatment for 48 h. Values below the blot indicate band quantification via densitometric analysis (ACE2/GAPDH) and are represented as fold change to vehicle-treated cells (0.1% v/v DMSO). (C) Representative histogram from flow cytometry showing overlay of cell surface ACE2 on Calu-3 cells following 48 h of the indicated treatments. (D–E) Quantification of ACE2 protein levels on Calu-3 (D; n = 3) or Vero E6 (E, n = 5) following BETi treatment for 48 h. ACE2 surface expression is shown as mean fluorescent intensity (MFI) ratio to isotype control (D–E). Error bars represent SD. * p < 0.05, *** p < 0.001, one-way ANOVA followed by Dunnett’s multiple comparison test.

