Figure 7.
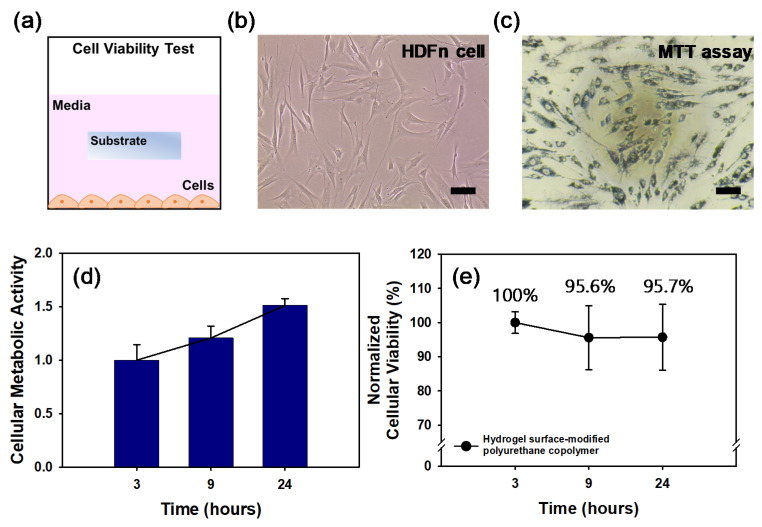
(a) Schematic design of cell viability test. Bright field images are Human dermal fibroblasts (HDFn) (b) on culture plate and (c) MTT assay for cytotoxicity. (scale bar; 100 μm) (d) The cellular metabolic activity measured at each time was normalized to the metabolic activity characterized right after cell stabilization on well. (e) The cell viability measured at each time was normalized to the characterized pure medium group at each time, comparing to the hydrogel surface-modified polyurethane copolymer.

