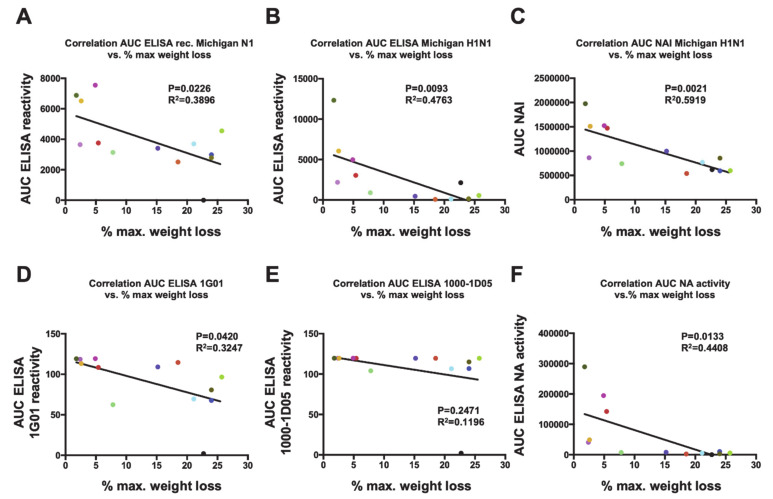
Figure 5.
Correlations between weight loss and antibody responses. Correlation analyses of the maximum percentage of weight loss (MPWL) after vaccination with the different NA constructs and viral challenge (refer to Figure 3) were performed against different parameters. MPWL vs. area under the curve (AUC) obtained from an ELISA using the recombinant tetrameric Mich15-VASP protein (A) or purified A/Michigan/45/2015 virus (B). MPWL vs. the AUC obtained from an NI assay using purified A/Michigan/45/2015 (C). MPWL vs. ELISA binding of the broadly reactive NA monoclonal antibodies 1G01 (D) and 1000-1D05 (E) to the respective recombinant NAs. MPWL vs. the enzymatic activity of the respective NAs (F). The colors of the dots are consistent with groups in the preceding figures.

