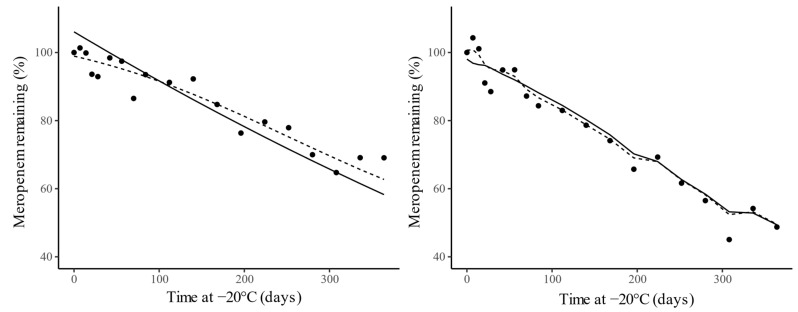
Figure 3.
Comparison between the experimentally measured degradation (points) and the predicted values of the polynomial model (solid line) and neural network (dotted line) for experiment 1 (E1—0.44 mg/L; left) and experiment 7 (E7—87.6 mg/L; right), with spiked Meropenem concentrations of 0.44 mg/L and 87.6 mg/L, respectively.

