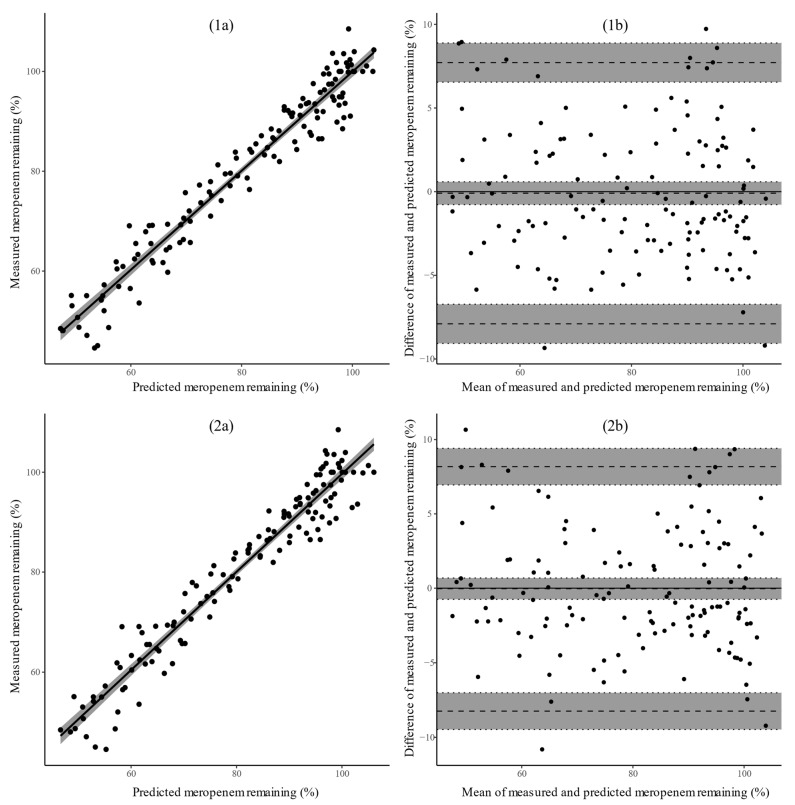
Figure 4.
Assessment of the correlation (left), r, between the predicted degradation and experimentally measured degradation for the ANN (1a) and polynomial model (2a). The straight black line corresponds to the best linear fit, while the gray shaded area visualizes the 95% confidence interval. Two-sided t-tests were computed to evaluate the null hypothesis that the predictions and observations are not linearly related. Assessment of the agreement (right) between the predicted degradation and experimentally measured degradation for the ANN (1b) and polynomial model (2b) by means of a Bland–Altman plot. The dashed horizontal lines correspond to the bias and limits of agreement (±1.96 SD), while the gray shaded area visualizes the 95% confidence intervals. Two-sided t-tests were computed to evaluate the null hypothesis that the mean difference between the predictions and observations is zero (no bias). All results were derived from predictions on the left-out test experiment, i.e., measured concentrations that the model has never seen (see Section 4.6).

