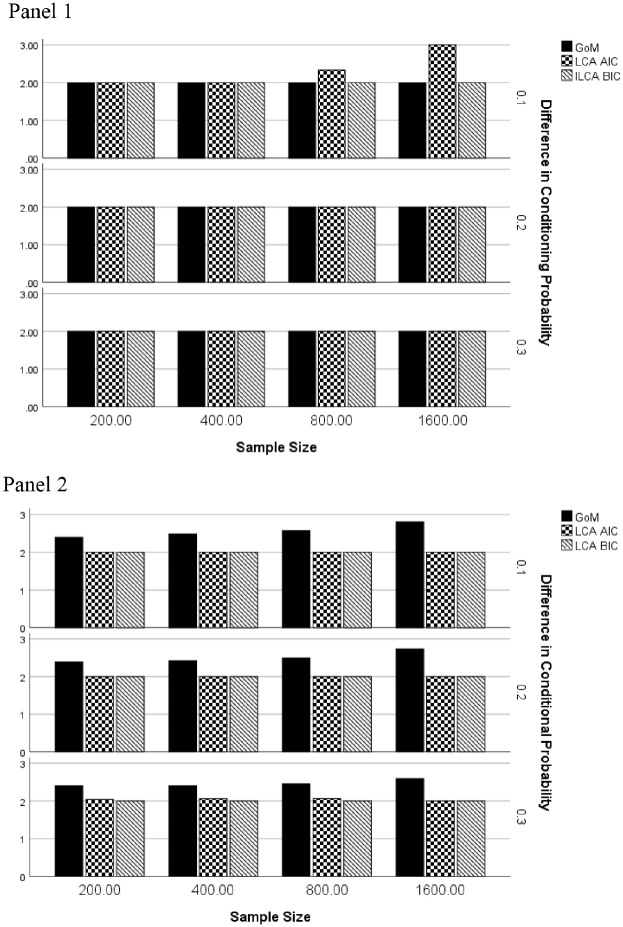
Figure 1.
Mean number of extreme latent profiles by total sample size, difference in conditional item endorsement probability, and estimation method: Two extreme latent profiles. Panel 1: GoM generating model. Panel 2: LCA generating model.Note. GoM = grade of membership; LCA = latent class analysis.

