
Figure 6.
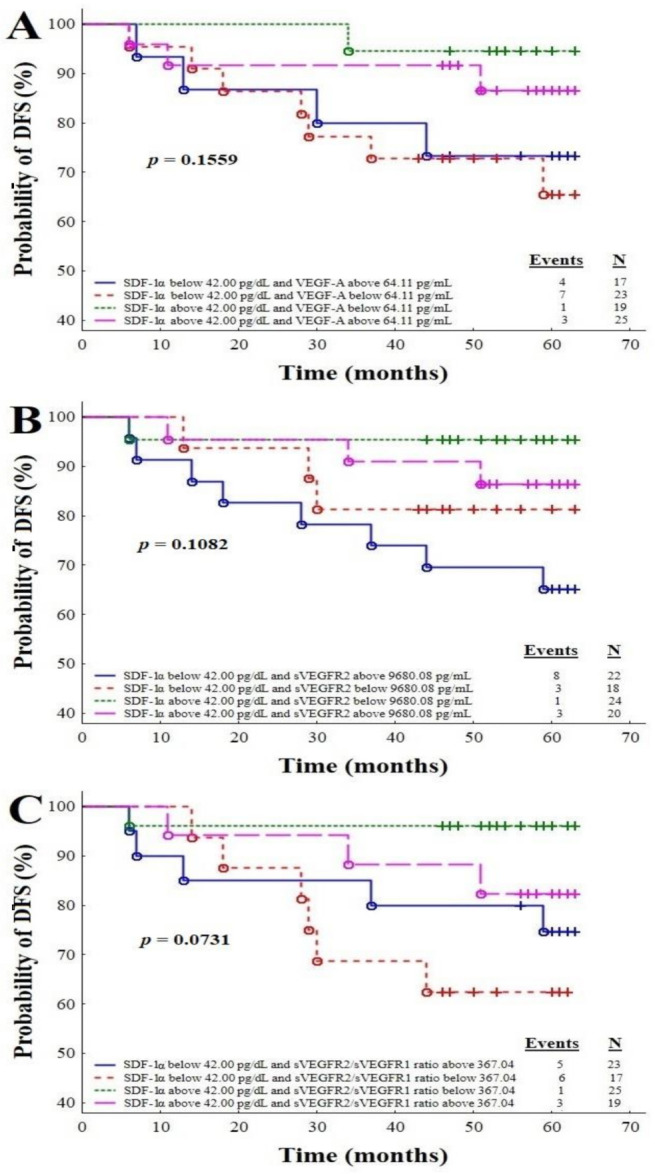
Plots A, B and C: Combinations of the SDF-1α level and VEGF-A (A), the SDF-1α level and sVEGFR2 (B), and the SDF-1α level and sVEGFR2/ sVEGFR1 ratio (C) for the prediction of disease relapse.
Official websites use .gov
A
.gov website belongs to an official
government organization in the United States.
Secure .gov websites use HTTPS
A lock (
) or https:// means you've safely
connected to the .gov website. Share sensitive
information only on official, secure websites.
Plots A, B and C: Combinations of the SDF-1α level and VEGF-A (A), the SDF-1α level and sVEGFR2 (B), and the SDF-1α level and sVEGFR2/ sVEGFR1 ratio (C) for the prediction of disease relapse.