
Figure 2.
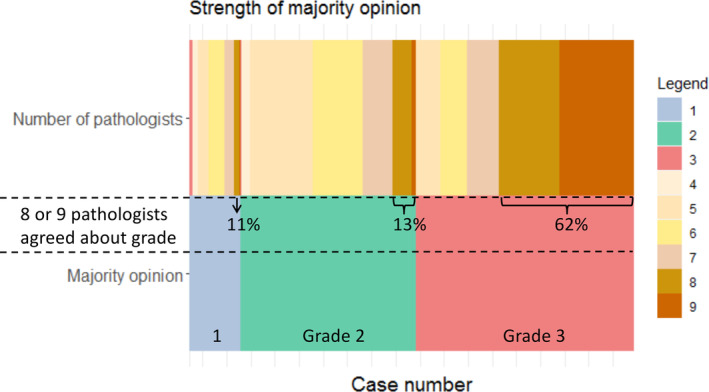
The strength of the majority opinion for low, intermediate, and high grade. The bottom row shows the distribution of DCIS grade according to the majority opinion and the upper row the number of pathologists that represent the majority opinion.