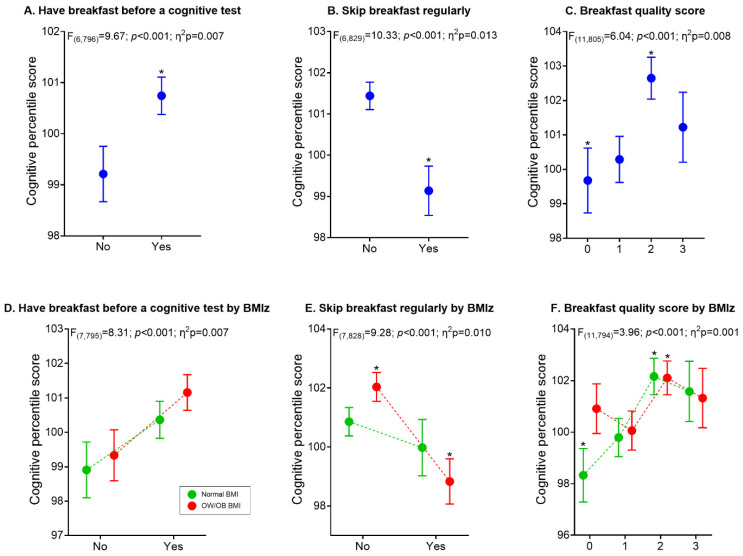
Figure 1.
Differences in adolescents’ cognitive performance according to breakfast consumption and quality. Models in figures (A–C) were adjusted to sex, peak high velocity, physical fitness, schools, and body mass index z-score. In contrast, models in figures (D–F) were adjusted to sex, peak high velocity, fitness, and schools. * Significative mean differences between groups. BMI: body mass index; OW: overweight; OB; obesity.

