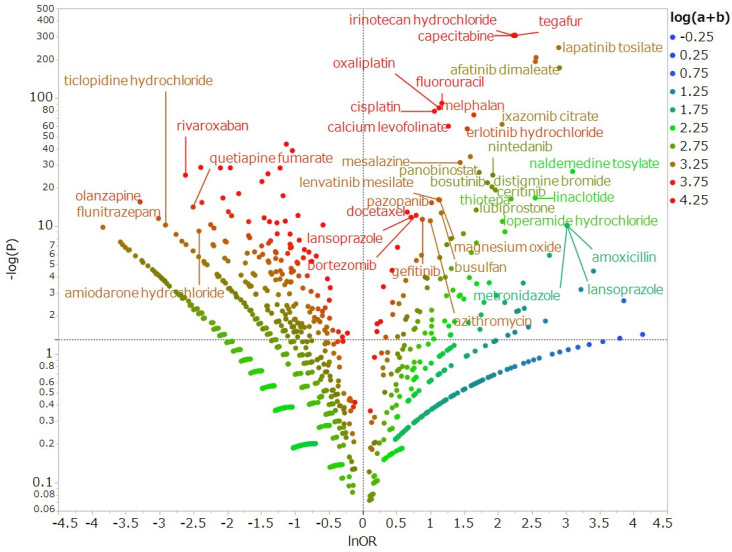
Figure 1.
Drugs associated with the development of diarrhea. The X-axis shows natural logarithm of odds ratio (lnOR) values, whereas the Y-axis shows common logarithm of inverse p-values (−log10 (p)) obtained by Fisher’s exact test. The dotted line on the Y-axis represents a p-value of 0.05. Plot colors represent the number of reported adverse events. Blue, green, and red dots are common logarithms of total reported numbers (from −0.25 to 4.25).

