
Figure 1.
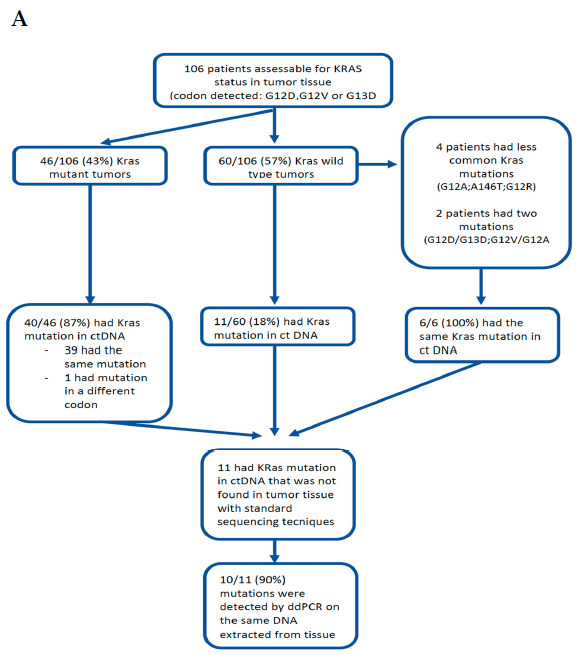
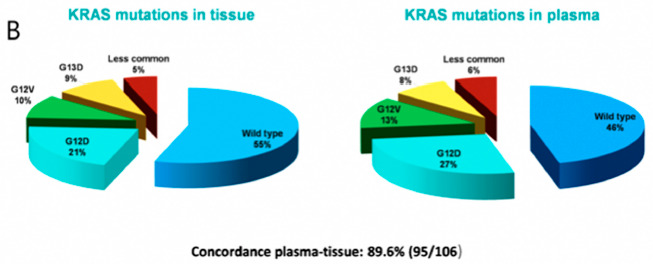
In Figure A, we present the study flow diagram and tissue availability in the ctDNA assessable population. In Figure B, we present the frequency of the most frequently-mutated KRAS mutation in tissue (A) and plasma (B) of patients who were assessable for the analysis of ctDNA. Concordance plasma-tissue was 89.6%.