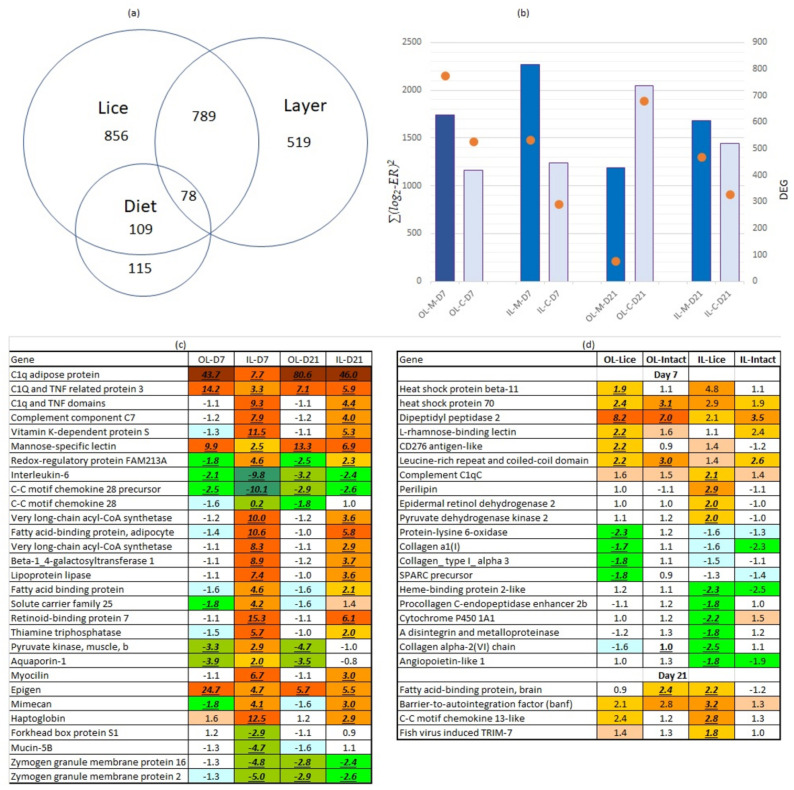
Figure 3.
Summary of transcriptome analyses (a) Venn diagram: numbers of genes that showed responses to lice, the difference between the skin layers, and diets in at least one comparison. (b) The magnitude of responses to lice assessed as ∑(log2-ER)2 (bars, left axis) and numbers of DEG (orange circles, right axis). (c) Genes with stronger responses to salmon louse in outer and inner skin layer at 7 dpc and 21 dpc. Data are expression ratios (folds) to intact skin (means for both diets), significant differences are indicated with underlined italic bold. (d) Effect of mineral supplementation on gene expression in outer and inner skin layer 7 dpc and 21 dpc. Data are expression ratios (folds) of salmon fed with M- and C-diets in lice infected (L) and intact skin (means for both diets), significant differences are indicated with underlined italic bold. Abbreviations: OL, IL—outer and inner layers, M, C—diets, D—days post-challenge. Red and green color in (c) and (d) denote up and down-regulation of the genes.

