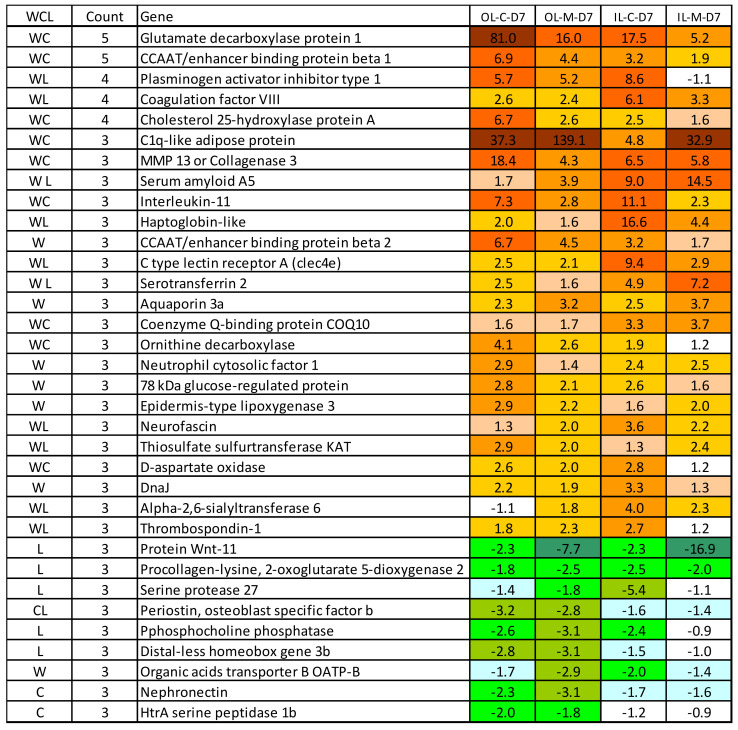
Figure 5.
Gene markers of lice responses to lice in Atlantic salmon skin, data are folds to intact skin. Genes with expression differences in at least three of five data sets were selected. First column represent study with response, only stable responses for wound (W), cortisol (C) and difference between the skin layers (L). Second column—number of data sets with differential expression (maximum five). The last columns show the transcriptional response in the present study. Abbreviations: OL, IL—outer and inner layers, M, C—diets, D—days post-challenge (dpc). Red and green color denote up and down-regulation of the genes.

