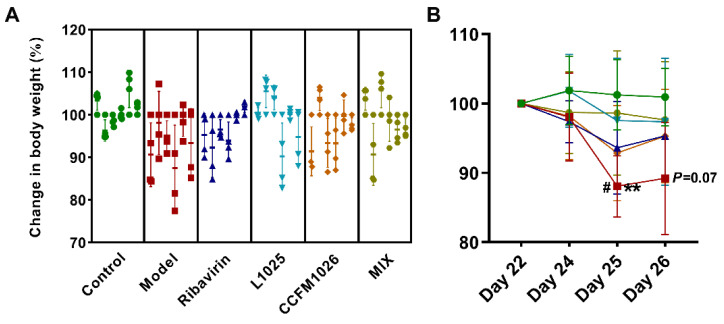
Figure 2.
Change in body weight of mice (A). Changes in body weight of every mouse (B). Changes in weight of mice in each group, and statistical analysis for the model group: **, day 25 vs. day 22; #, day 25 vs. day 24; and p = 0.07, day 26 vs. day 22 (two-way ANOVA and Tukey’s multiple comparisons).

