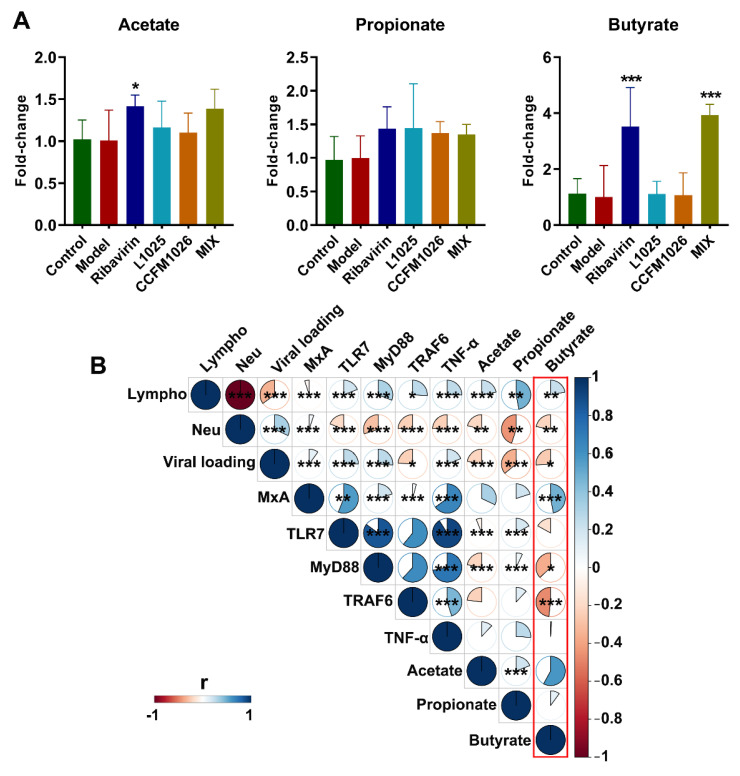
Figure 8.
Short-chain fatty acids (SCFA) production and the correlation with disease indicators. (A) Fold-change in SCFA (the statistical difference was evaluated using one-way ANOVA and post hoc Fisher’s least significant difference (LSD) tests, *, *** vs. the model group). (B) The correlation between SCFA and disease indicators. * p < 0.05, ** p < 0.01 and *** p < 0.001.

