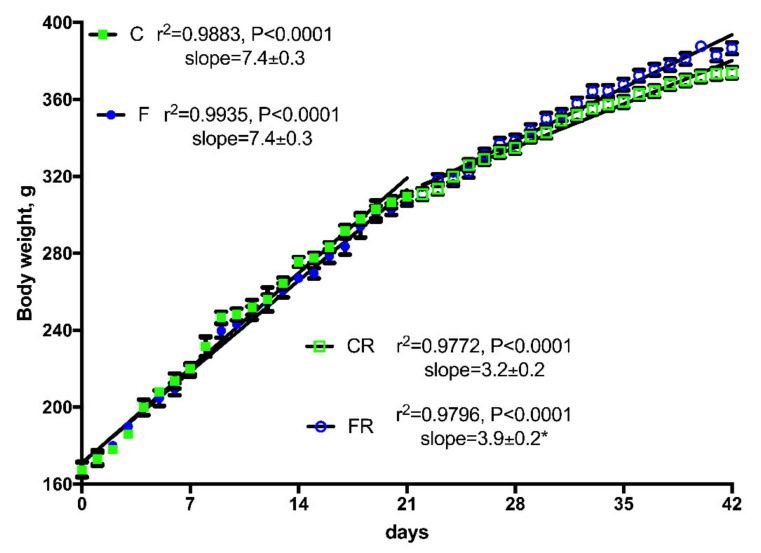
Figure 2.
Body weight gain in control (C), fructose (F), control rescue (CR), and fructose rescue (FR) rats. Values are the means ± SEM of 16 (C and F) or eight (CR and FR) different rats. Linear regression analysis showed that line for FR rats was significantly different (p < 0.05) from line for CR rats. * Slope from FR rats was significantly higher (p < 0.05) than that from CR rats.

