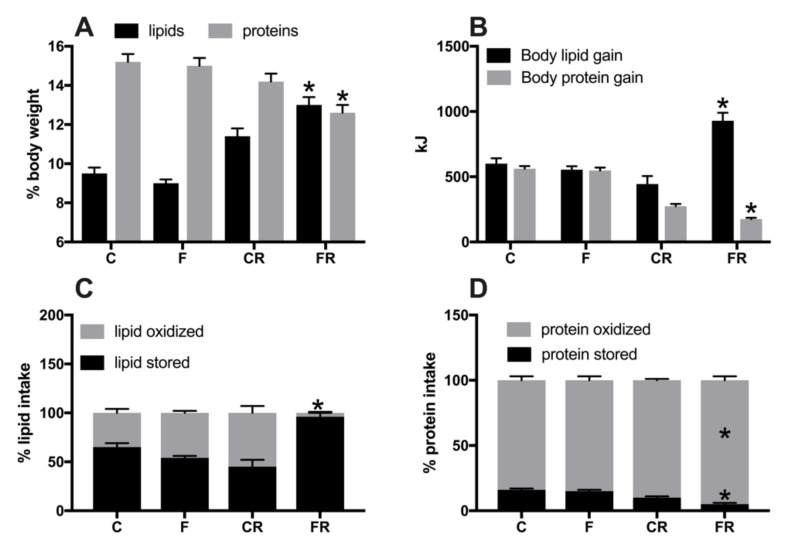
Figure 3.
Body lipid and protein content (A), body lipid and protein gain (B), lipid (C) and protein (D) partitioning in control (C), fructose (F), control rescue (CR), and fructose rescue (FR) rats. Values are the means ± SEM of eight different rats. * p < 0.05 compared to respective control (one-way ANOVA followed by Tukey post-test).

