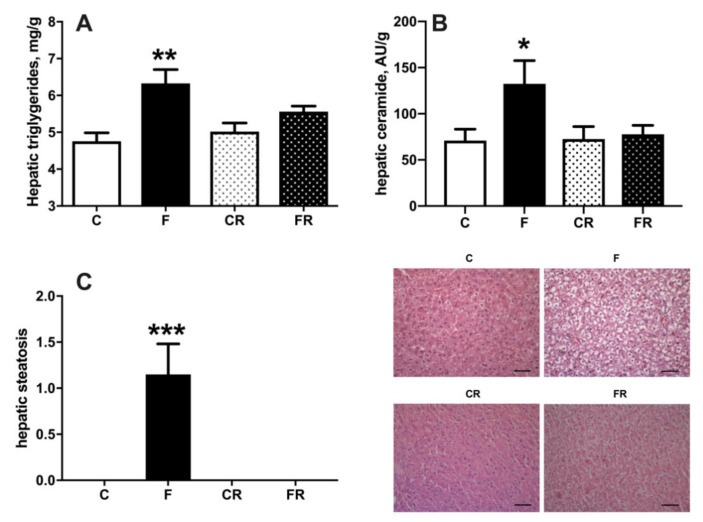
Figure 6.
Triglycerides (A), ceramide (B), and degree of steatosis (C), in liver from control (C), fructose (F), control rescue (CR), and fructose rescue (FR) rats. Values are the means ± SEM of eight different rats. * p < 0.05, ** p < 0.01, *** p < 0.001 compared to respective control (one-way ANOVA followed by Tukey post-test). Scalebar = 50 μm.

