Figure 1.
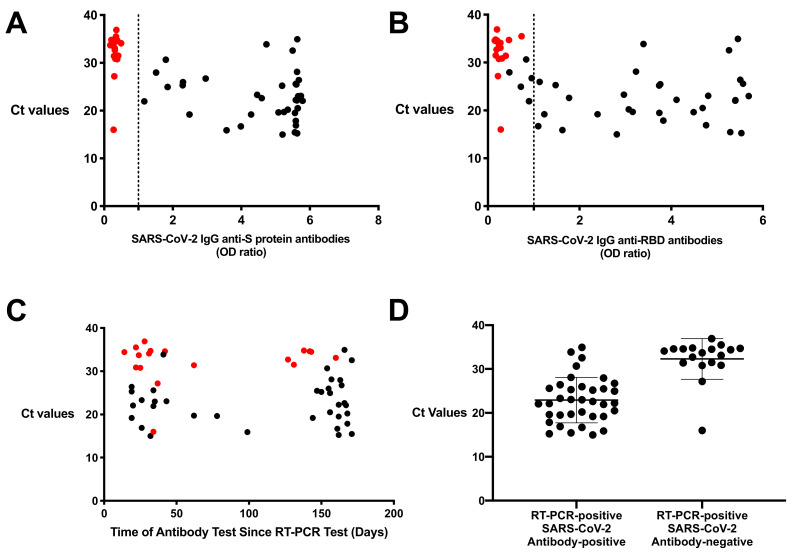
Ct values were variable in resolved subjects who test SARS-CoV-2 antibody negative or positive. Ct values of a subset of resolved subjects (n = 54) were compared to their corresponding SARS-CoV-2 (A) anti-S protein IgG and (B) anti- receptor-binding domain (RBD) IgG. (C) Ct values were then compared to the subjects’ respective time since initial RT-PCR test. (D) Ct values for RT-PCR-positive in antibody-positive and antibody-negative were compared. Values are shown as a ratio of observed optical density to the determined assay cut-off optical density or time since RT-PCR test until blood donation compared to absolute Ct values. Red circles indicate resolved samples who were RT-PCR-positive/antibody-negative.

