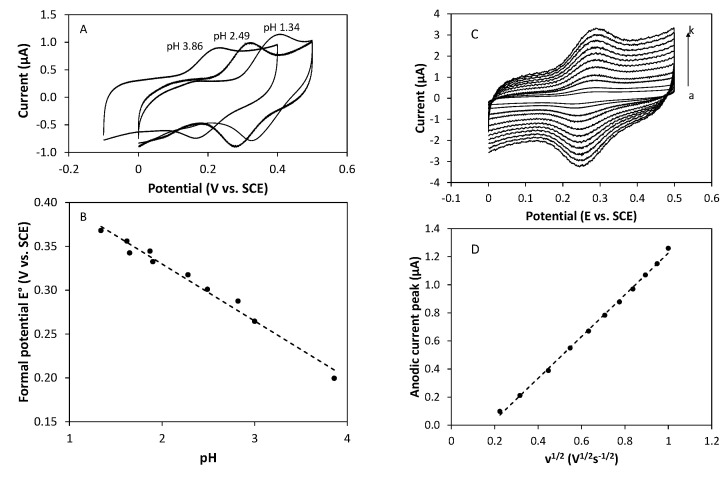
Figure 9.
(A) Cyclic voltammograms recorded at 100 mV s−1 on a glassy carbon electrode in phosphate buffer marennine solutions (1 mg mL−1) at different pH. (B) Plot of the formal potential vs. solution pH. (C) Cyclic voltammograms recorded on a glassy carbon electrode in a phosphate buffer solution (pH 3) containing marennine (1 mg mL−1) at different scan rates: (a) 50 mV s−1, (b) 100 mV s−1, (c) 200 mV s−1, (d) 300 mV s−1, (e) 400 mV s−1, (f) 500 mV s−1, (g) 600 mV s−1, (h) 700 mV s−1, (i) 800 mV s−1, (j) 900 mV s−1, and (k) 1000 mV s−1. (D) Plot of the anodic current peak intensity vs. the square root of the scan rate.

