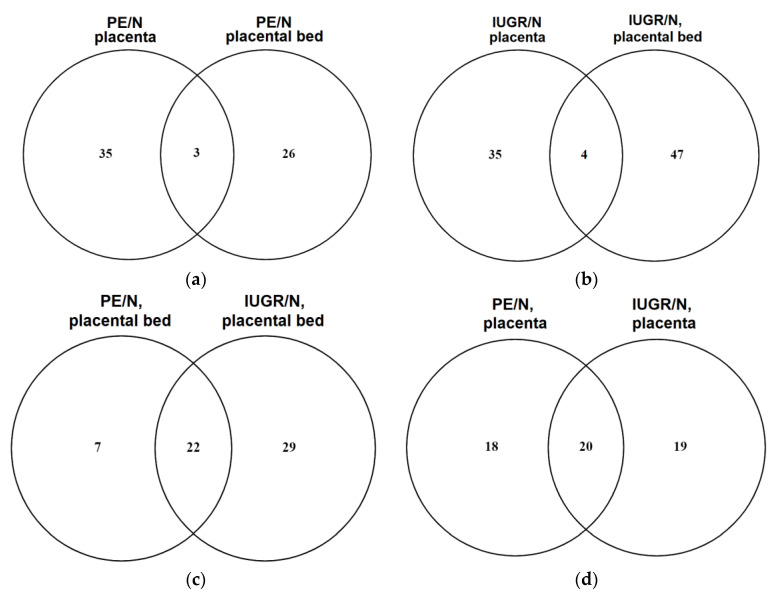
Figure 2.
Venn diagrams. A comparison of the lists of differentially expressed proteins in (a) placenta vs. placental bed samples from patients with PE < 34; (b) placenta vs. placental bed samples from patients with IUGR < 34; (c) placental bed samples from patients with PE < 34 vs. IUGR < 34; (d) placenta samples from patients with PE < 34 vs. IUGR < 34.

