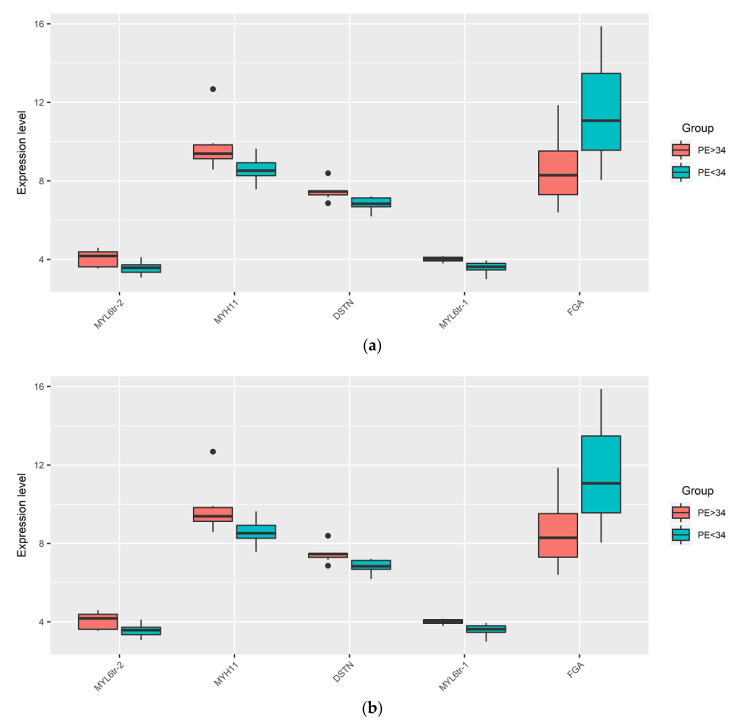
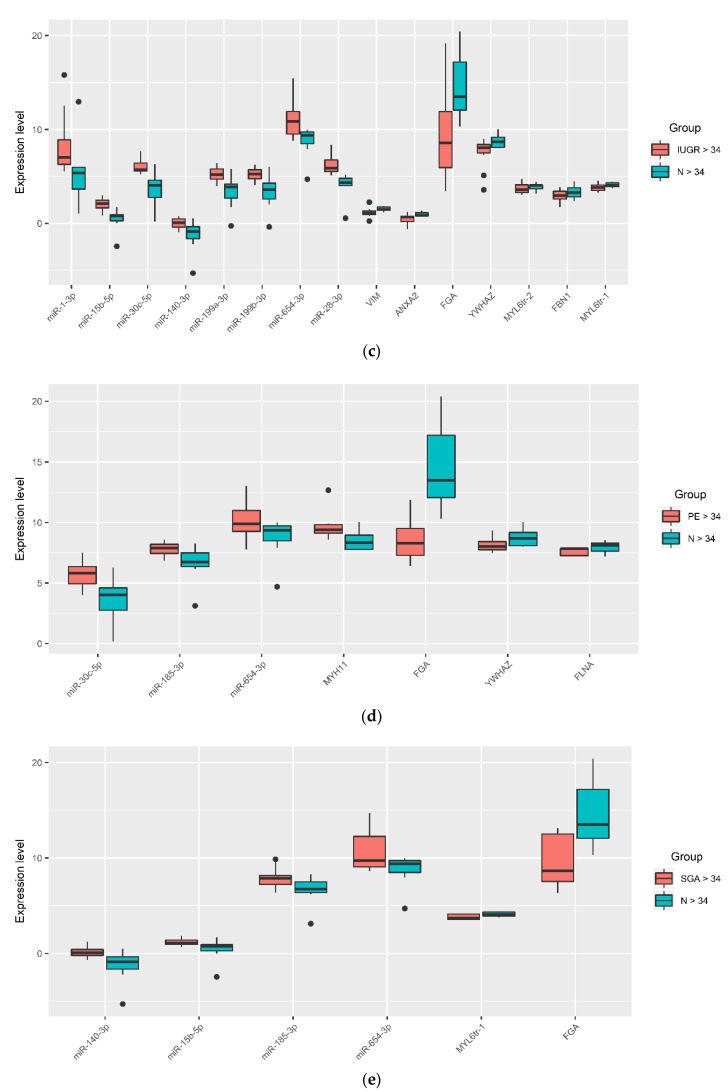
Figure 3.
Box-plots of the expression level of miRNAs and their target genes in the placental bed samples by quantitative RT-PCR. Comparison of ∆Ct values of miRNA and mRNA in groups with IUGR < 34 vs. IUGR > 34 (a); PE < 34 vs. PE > 34 (b); IUGR > 34 vs. N > 34 (c); PE > 34 vs. N > 34 (d); SGA > 34 vs. N > 34 (e).


