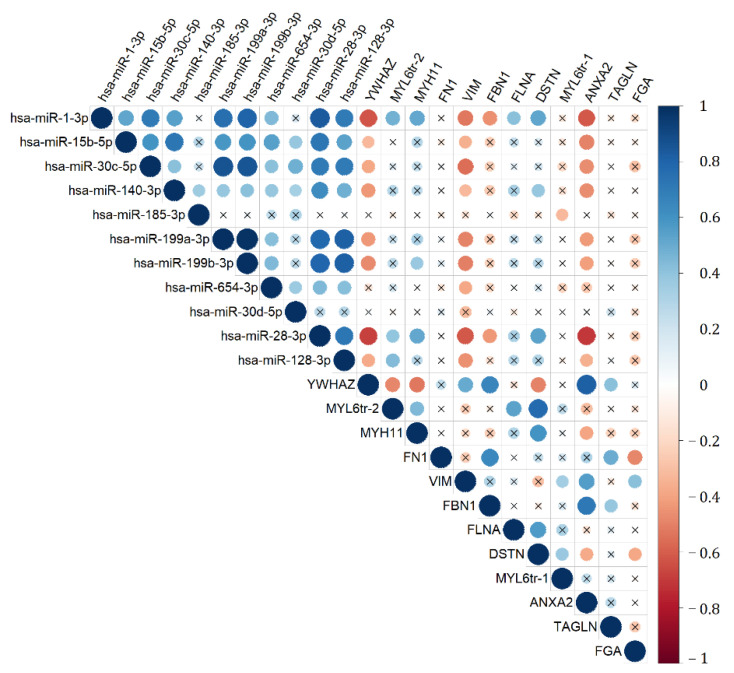
Figure 4.
Correlation matrix based on the analysis of the miRNAs and gene target expression levels in the IUGR > 34, SGA > 34, PE > 34, and N > 34 groups obtained while using nonparametric Spearman rank correlation method. Positive and negative correlations are indicated in blue and in red, respectively. In the case of significant (p < 0.05) values, correlations are indicated by a dot; in the case of nonsignificant values, correlations are indicated by a cross.

