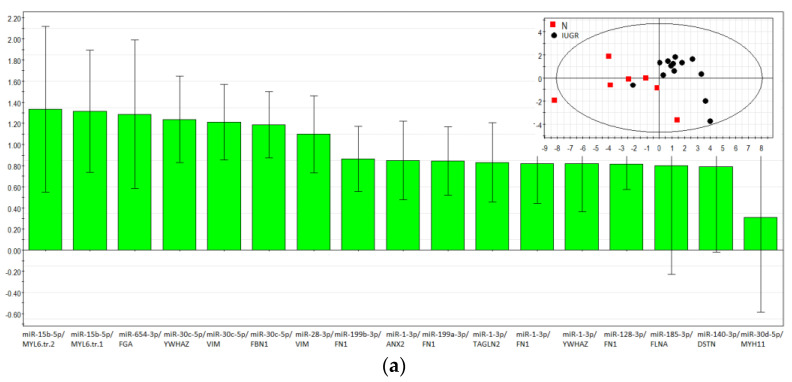
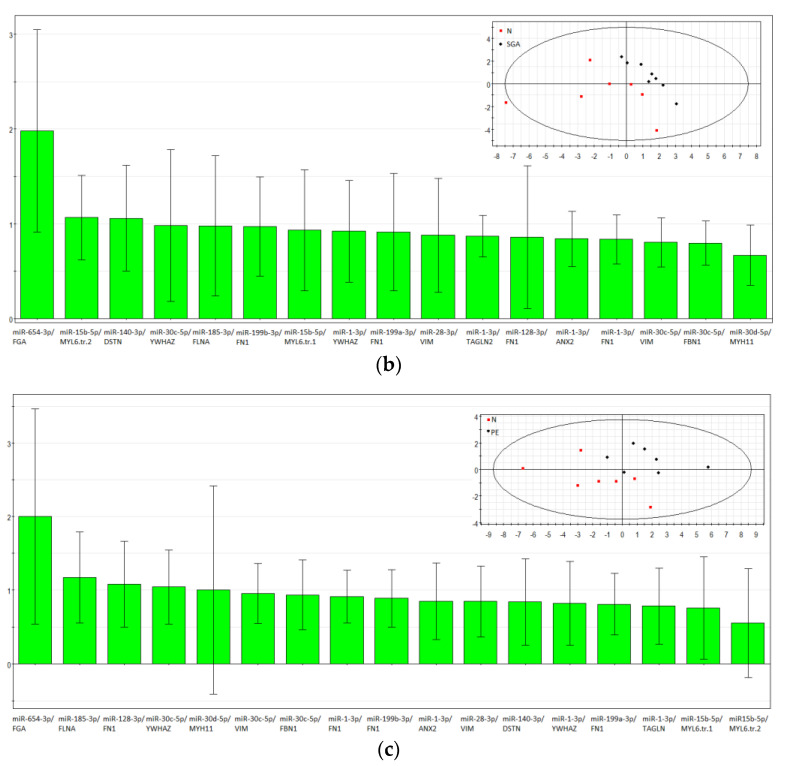
Figure 5.
Partial least squares discriminant analysis (PLS-DA). Variable importance in projection (VIP) score plots using (−ΔΔCt) RT-PCR data on the fold change expression level of miRNA relative to its target gene in a sample from the IUGR > 34 and N > 34 groups (a), the SGA > 34 and N > 34 groups (b), and the PE > 34 and N > 34 groups (c). Score plots with the imposition of information of the miRNA‒gene target fold change in the expression level on the sample group type are presented as inserts in the upper right corner of (a–c).


