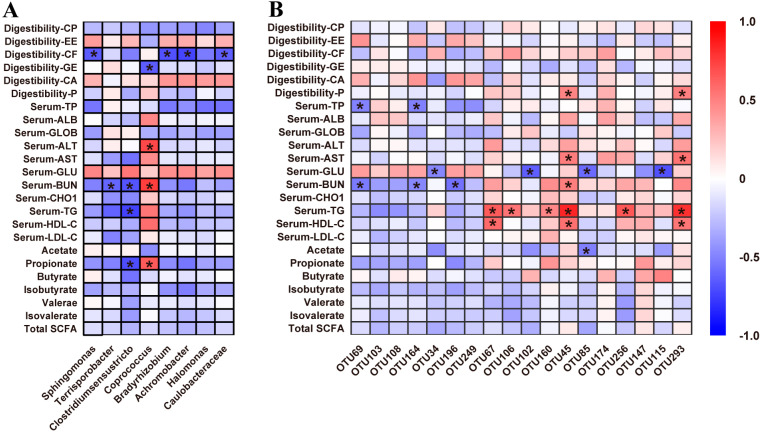
Figure 5.
The dietary protein level affects the correlation analysis between differentiated fecal bacteria and different indices of feces in nursery pigs. (A) Genus level. (B) OTU level. The color indicates the Pearson coefficient distribution. Red represents a positive correlation, while blue represents a negative correlation. * indicates p < 0.05.

