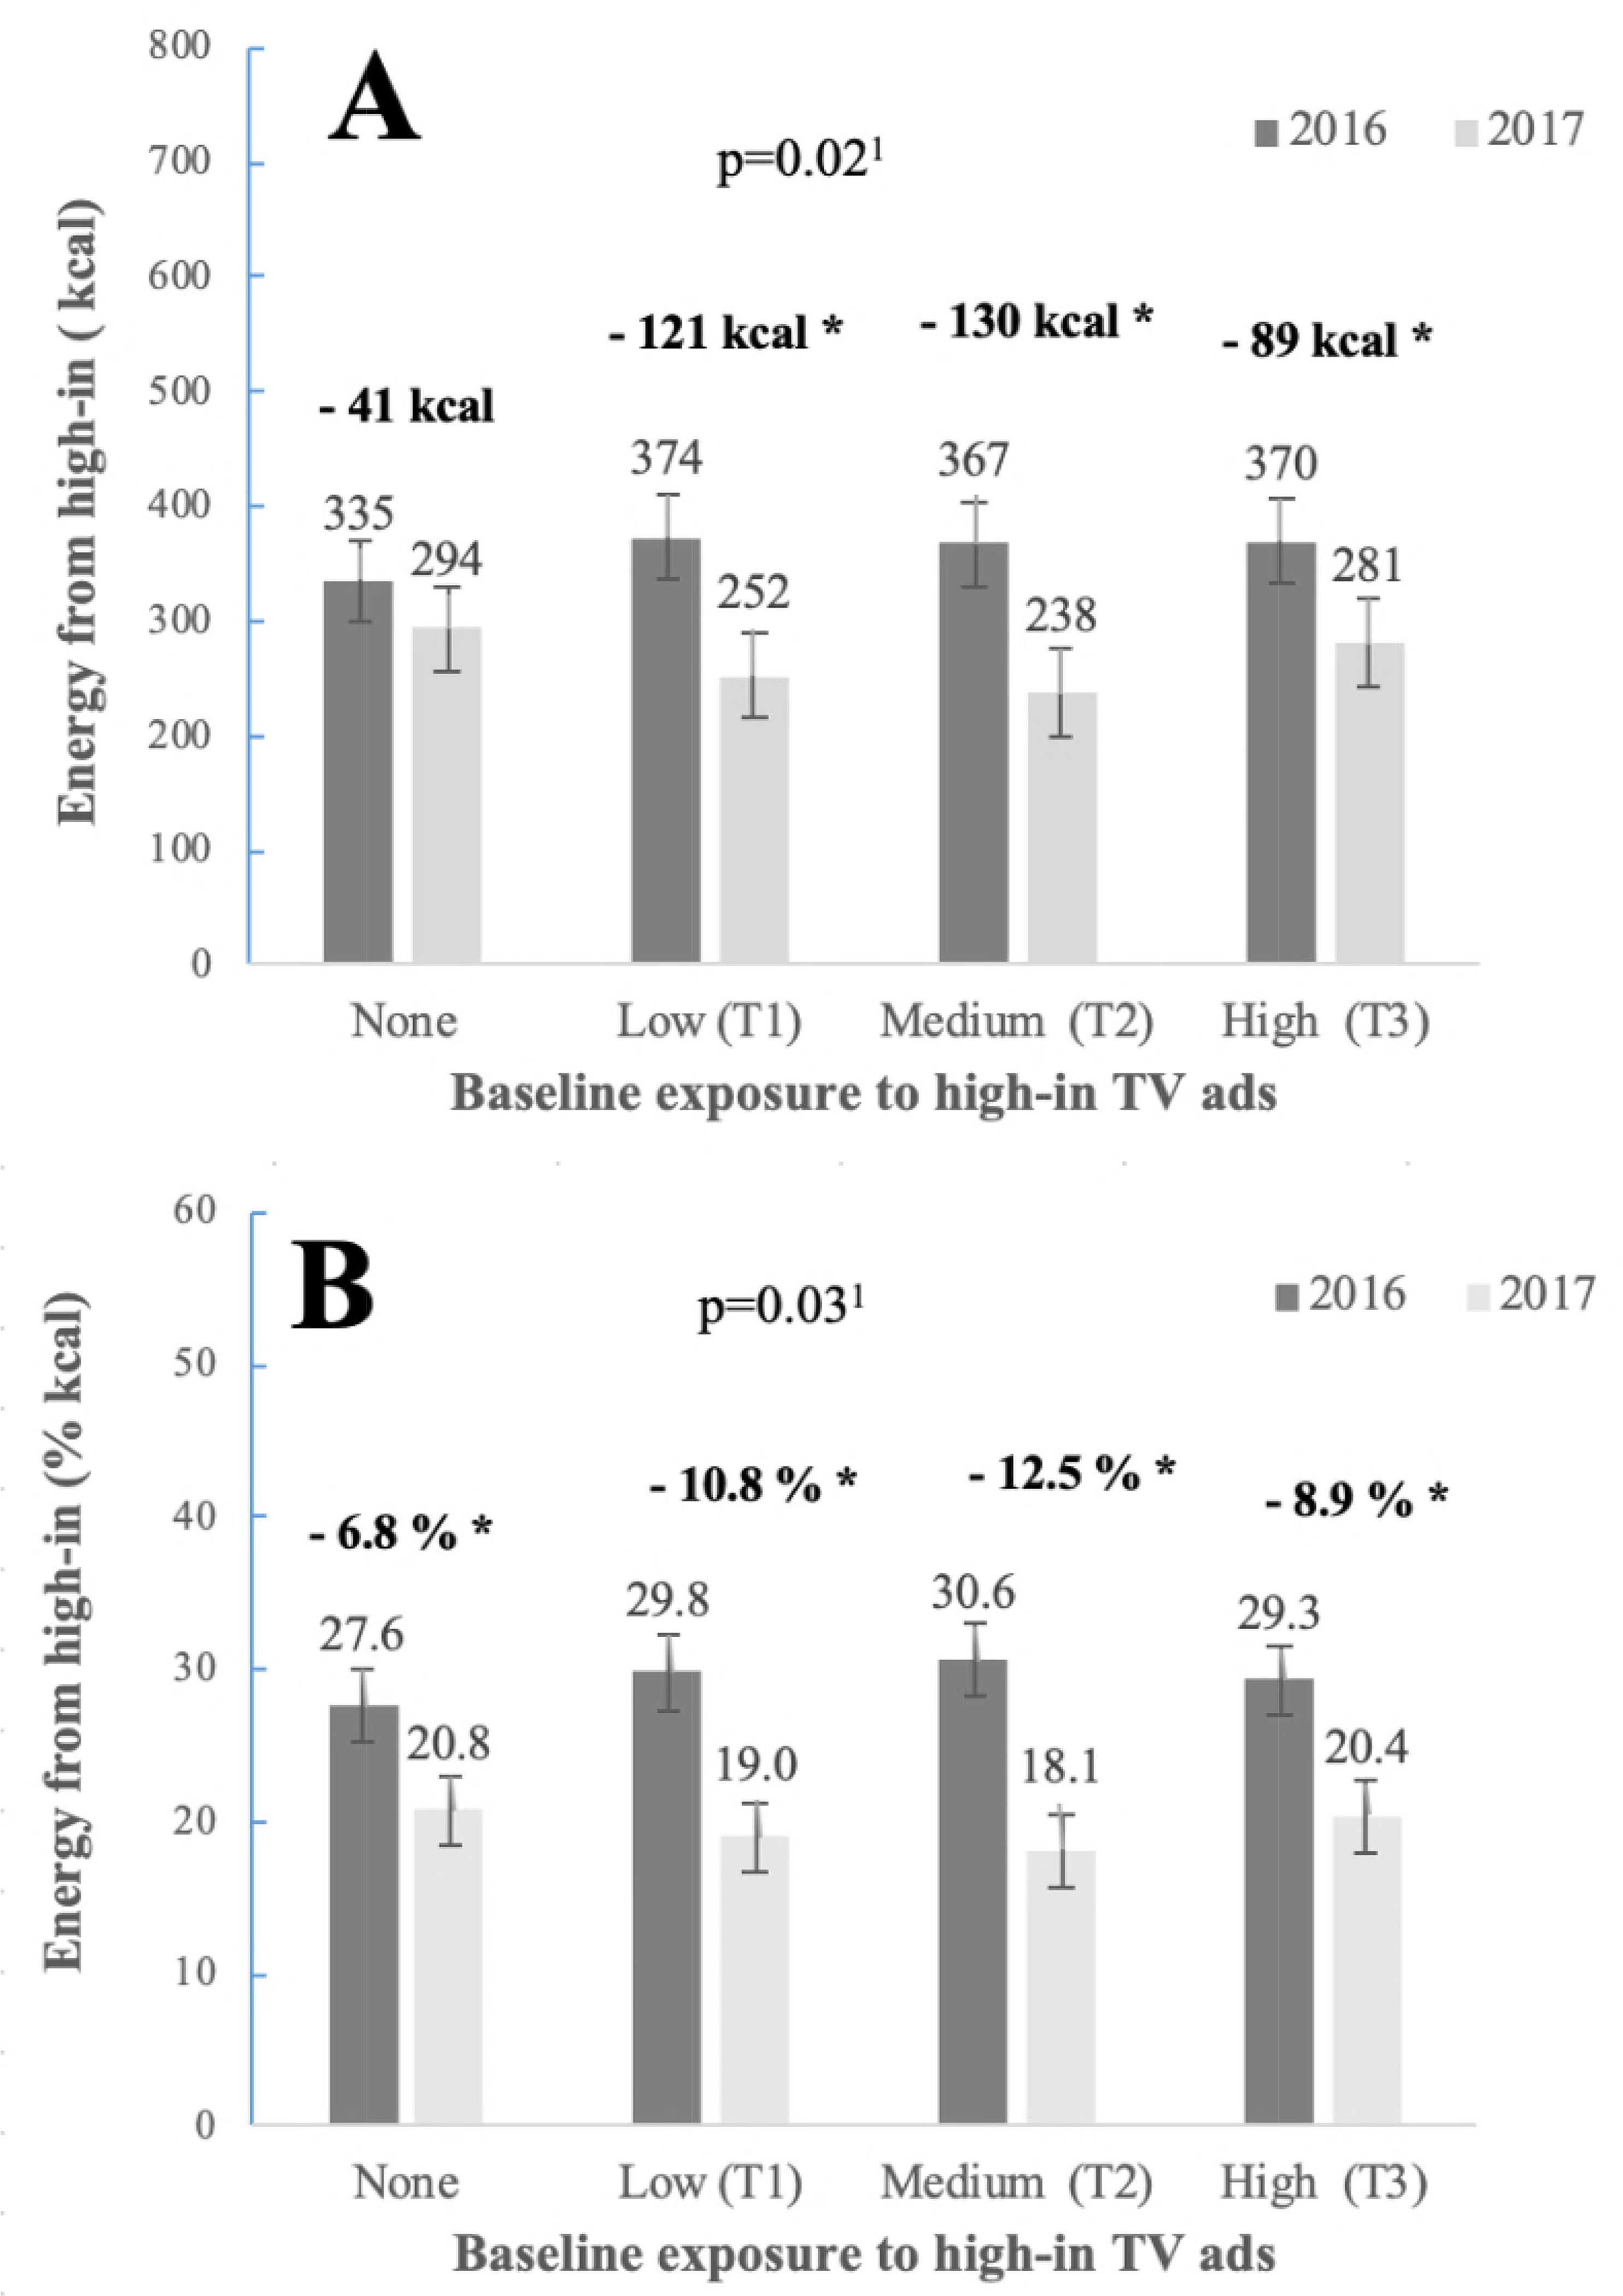
Figure 2.

Participants (n=853) consumption of high-in foods (A: absolute intake, B: energy adjusted) pre- and post-policy by baseline levels of high-in TV advertising. Estimated using mixed model with individuals as a random effect, adjusting for study covariates. 1Wald test for interaction (year*baseline ad exposure).*indicates p<.05.
