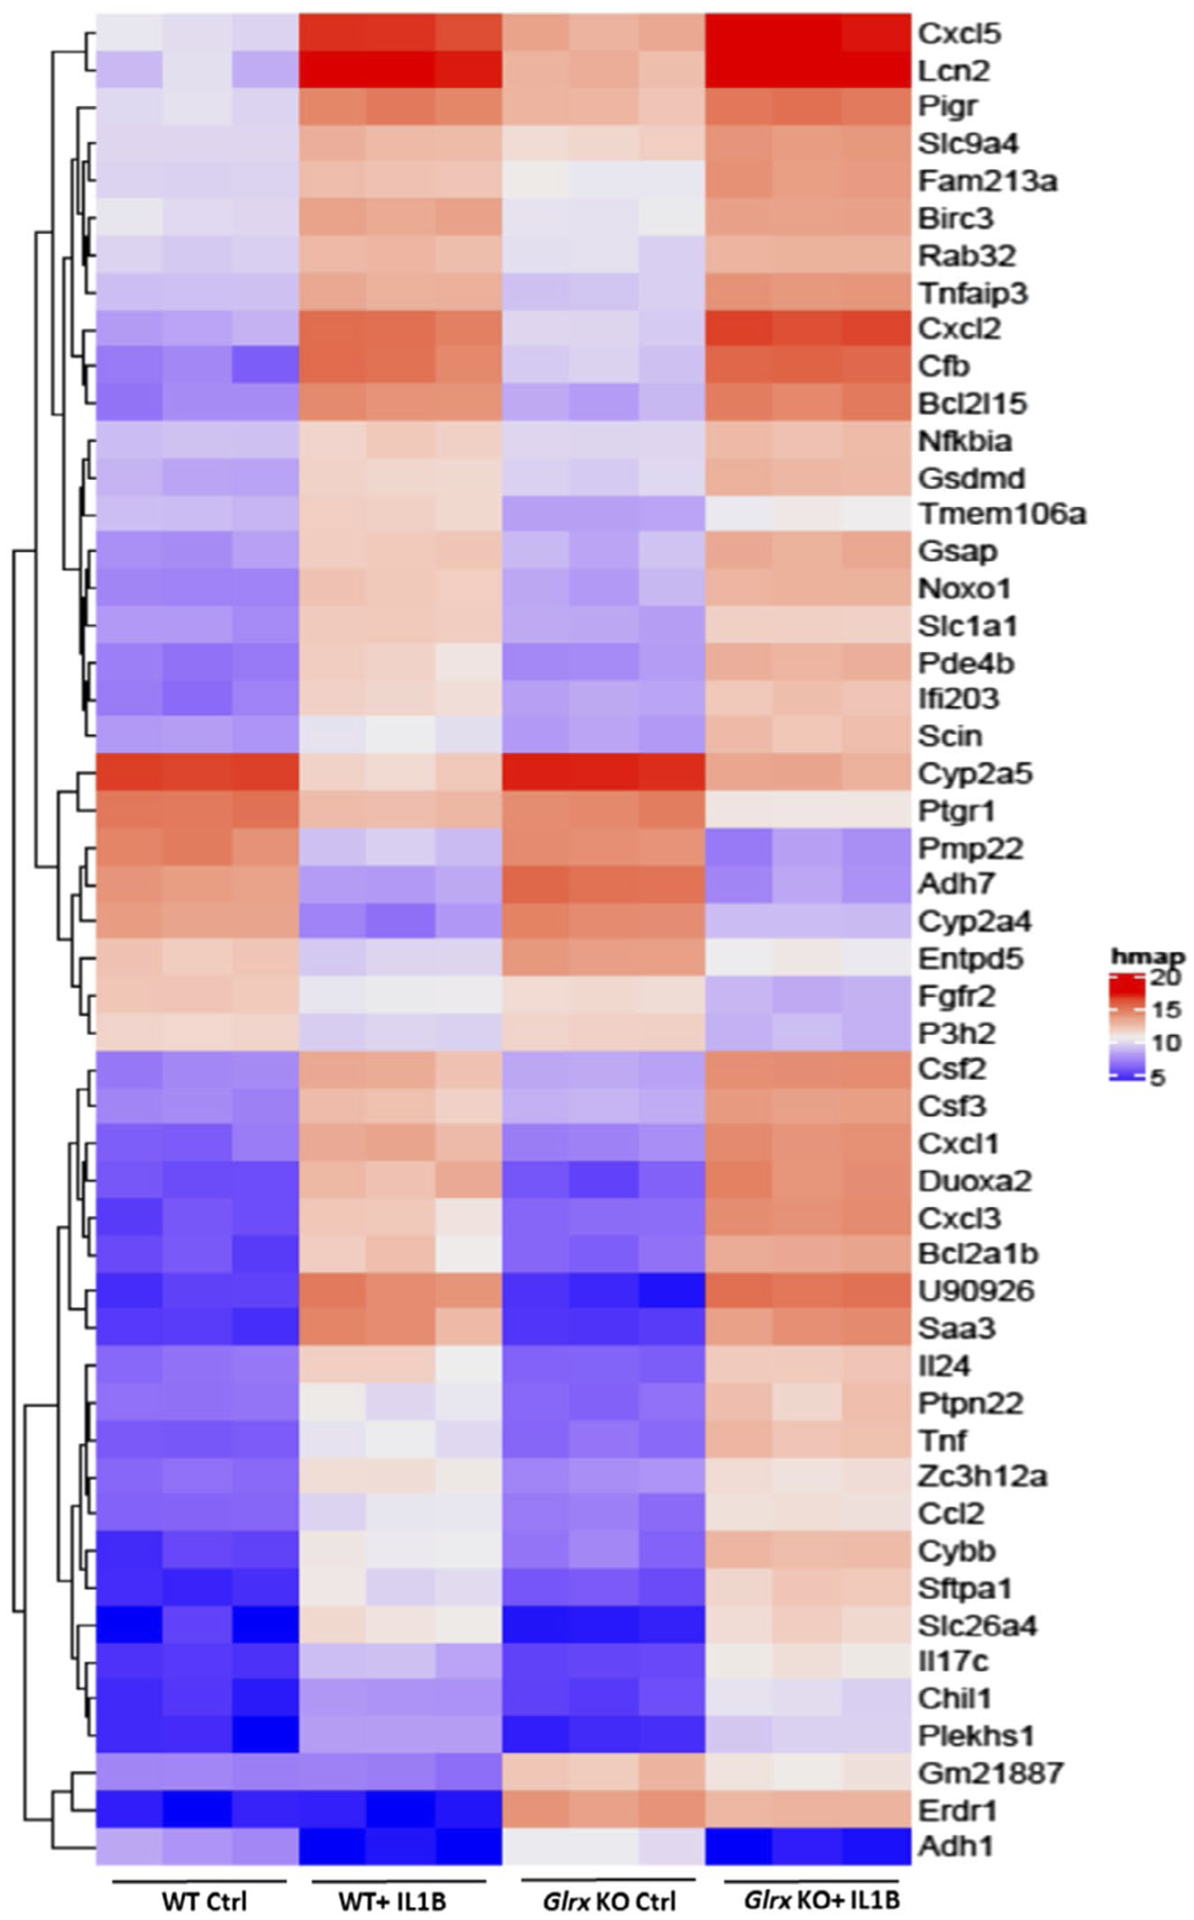
FIGURE 3.

Microarray analysis in WT or Glrx−/− airway basal cells stimulated with IL1B. Heat map for the top 50 differentially regulated genes in the four groups. P values were calculated by comparing all four comparisons using Linear Models for Microarray Data (LIMMA)
