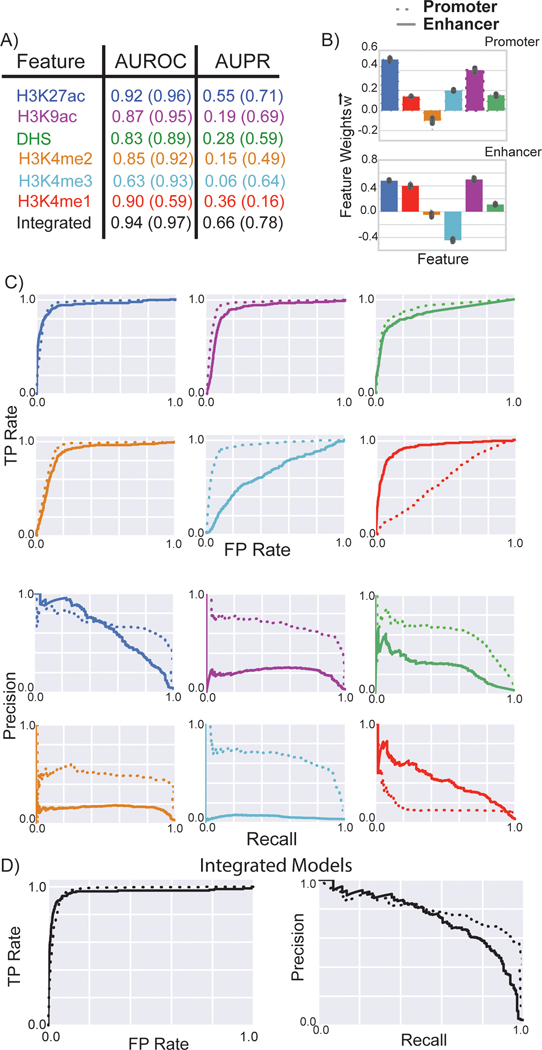
Figure 3: Performance of matched filters and integrated models for predicting promoters and enhancers.
The performance of the matched filters of different epigenetic marks and the integrated model for predicting active promoters and enhancers were compared using ten-fold cross validation. A) The numbers within parentheses refer to the AUROC and AUPR for predicting promoters; the numbers outside the parentheses refer the performance of the models for predicting enhancers. B) Weights of the different features in the integrated models for promoter and enhancer prediction are plotted; the mean value is displayed in the bar plot while the error bars show the standard deviation of feature weights measured by ten-fold cross validation. C-D) The ROC and PR curves for each matched filter and the integrated model are shown. The performance of these features and the integrated model for predicting the active promoters and enhancers using multiple core promoters were compared.

