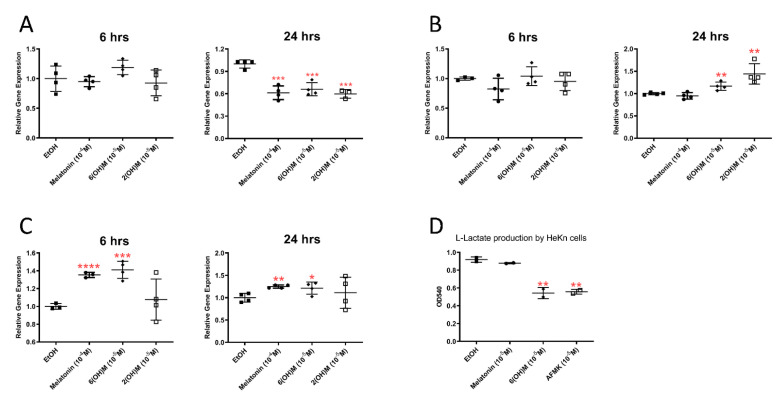
Figure 6.
The effect of melatonin and its metabolites on the expressions of LDHA (A), PGC-1 (B) and SIRT-1 (C), and lactate production (D). Human epidermal (HaCaT) keratinocytes were cultured in presence of absence of the listed concentrations of the compounds and qPCR was performed as described in Materials and Methods with cyclophilin B as housekeeping gene. Each panel shows fold changes after calculated using delta-delta Ct normalized with housekeeping gene. Lactate accumulation in culture media is shown (D). The plots represent all values with calculated means and significance was evaluated both by Mann–Whitney U test and Student t-Test, which showed the same p values: * p < 0.05; ** p < 0.01; *** p < 0.001; **** p < 0.0001.

