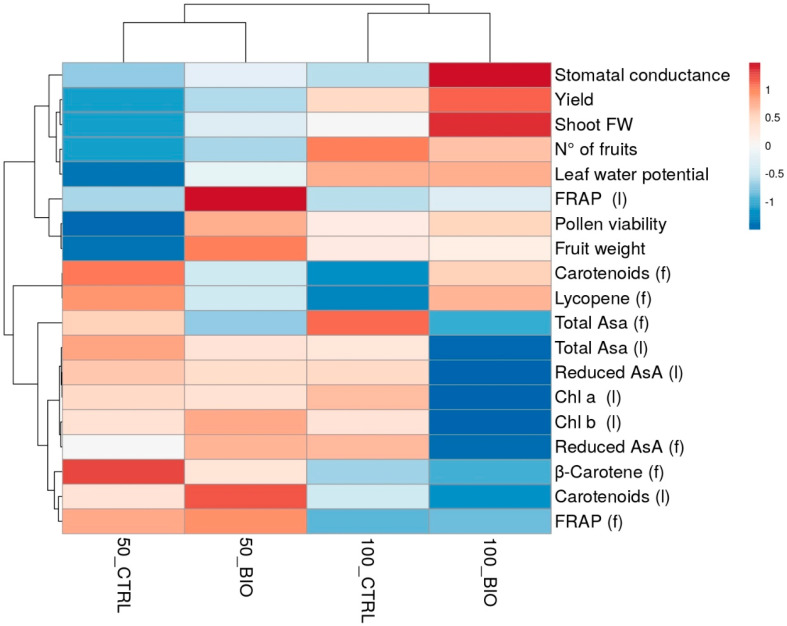
Figure 5.
Heat map analysis summarizing plant responses to biostimulant application and water deficit in plants grown in Battipaglia under optimal (100) and limited water availability (50) and treated (BIO) or not (CTRL) with the protein hydrolysate. The letters in brackets indicate measurements taken from leaves (l) and fruits (f). The Figure was generated using the http://biit.cs.ut.ee/clustvis (accessed on 1 April 2021) program package with Euclidean distance as the similarity measure and hierarchical clustering with complete linkage.

