Figure 2.
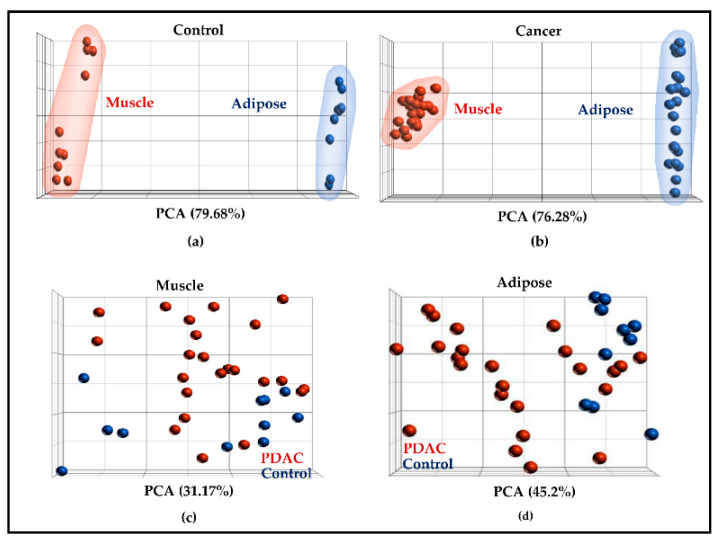
Principal component analysis. All the profiled genes were utilized for the analysis. (a,b) Indicate that gene expression gene signatures between muscle (a) and adipose (b) were indeed different in controls and PDAC; (c,d) illustrate the PCA within muscle (c) and adipose in controls and PDAC (d).

