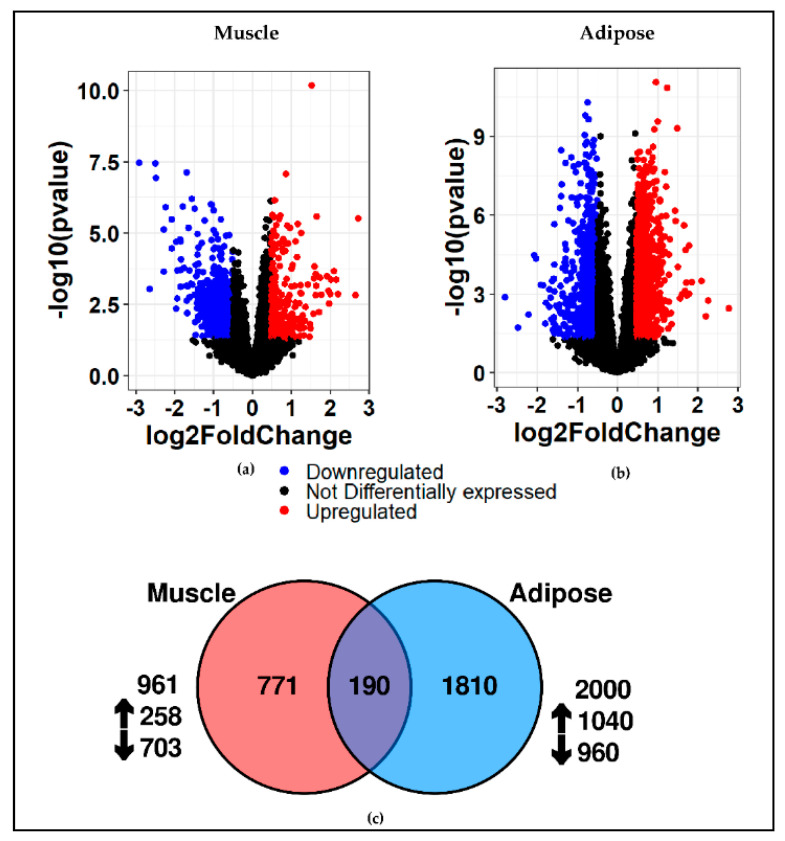
Figure 3.
Identification of differentially expressed genes in muscle and adipose. Volcano plot showing the differentially expressed genes for muscle (a,b) adipose at 1.4 fold change and p-value of 0.05. Red indicates upregulation and blue indicates downregulation; (c) the common differentially expressed genes between muscle and adipose is ~7%.

