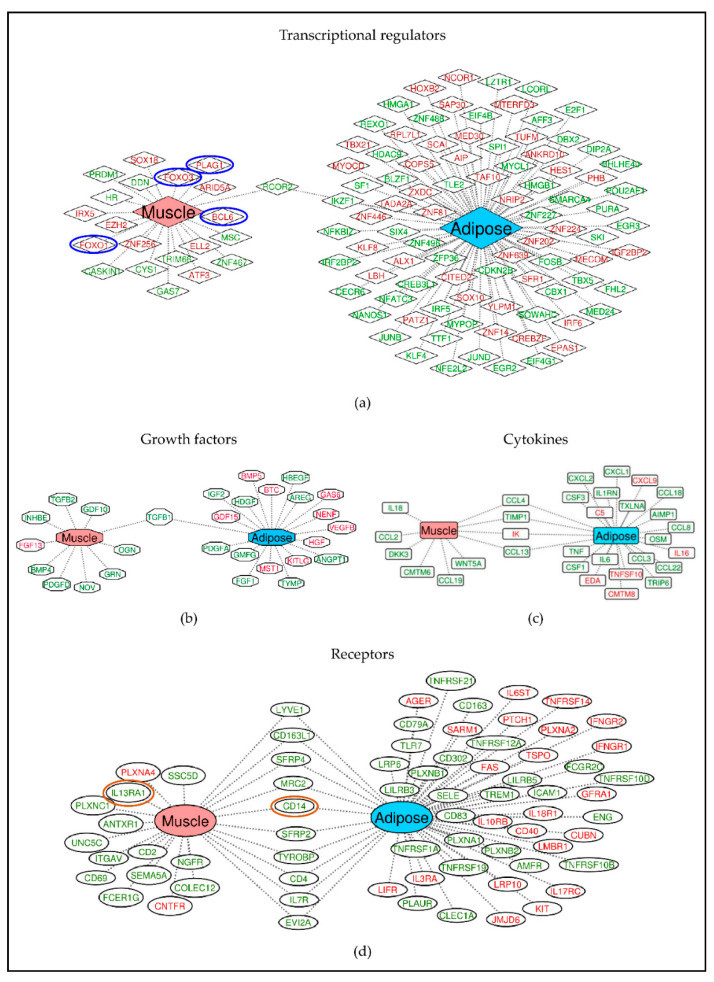
Figure 5.
Tissue specific expression of different classes of molecules including transcriptional regulators (a), growth factors (b), cytokines (c) and receptors (d). Differentially expressed genes were given as input in IPA and the genes were classified based on their known functions. A strong tissue specific gene expression pattern exists across classes. The genes in red text are upregulated and green text are downregulated genes. The genes represented in between are commonly expressed between muscle and adipose. The genes that are circled in red and blue are also present in aged muscle dataset where the blue circles indicate same direction of effect (upregulated) and red indicates opposite direction of effect (up in one and down in other).

