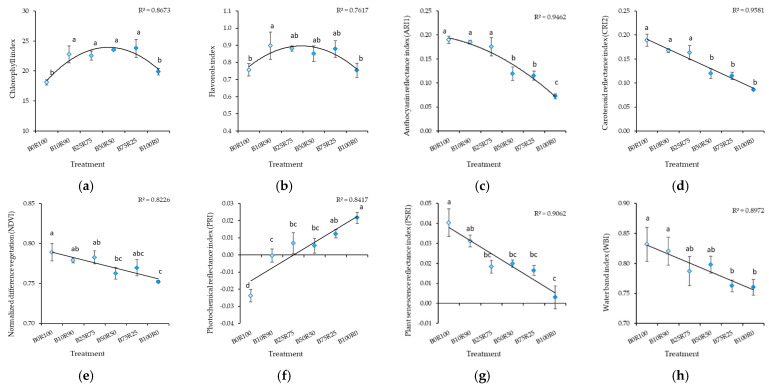
Figure 2.
Effect of different blue–red light ratios in LED lighting on the chlorophyll (CHL) (a), flavonols (FLA) (b), anthocyanin reflectance (ARI1) (c), carotenoid reflectance (CRI2) (d), normalized difference vegetation (NDVI) (e), photochemical reflectance (PRI) (f), plant senescence reflectance (PSRI) (g), and water band (WBI) (h) of mustard microgreens. B0R100, B10R90, B25R75 B50R50, B75R25, and B100R0: indicate the percentage of blue (B) and red (R) light. All values in the table are expressed as mean ± standard error (n = 3). Means with different letters are significantly different at the p < 0.05 level according to Tukey’s honestly significant difference test.

